
Quick Summary
-
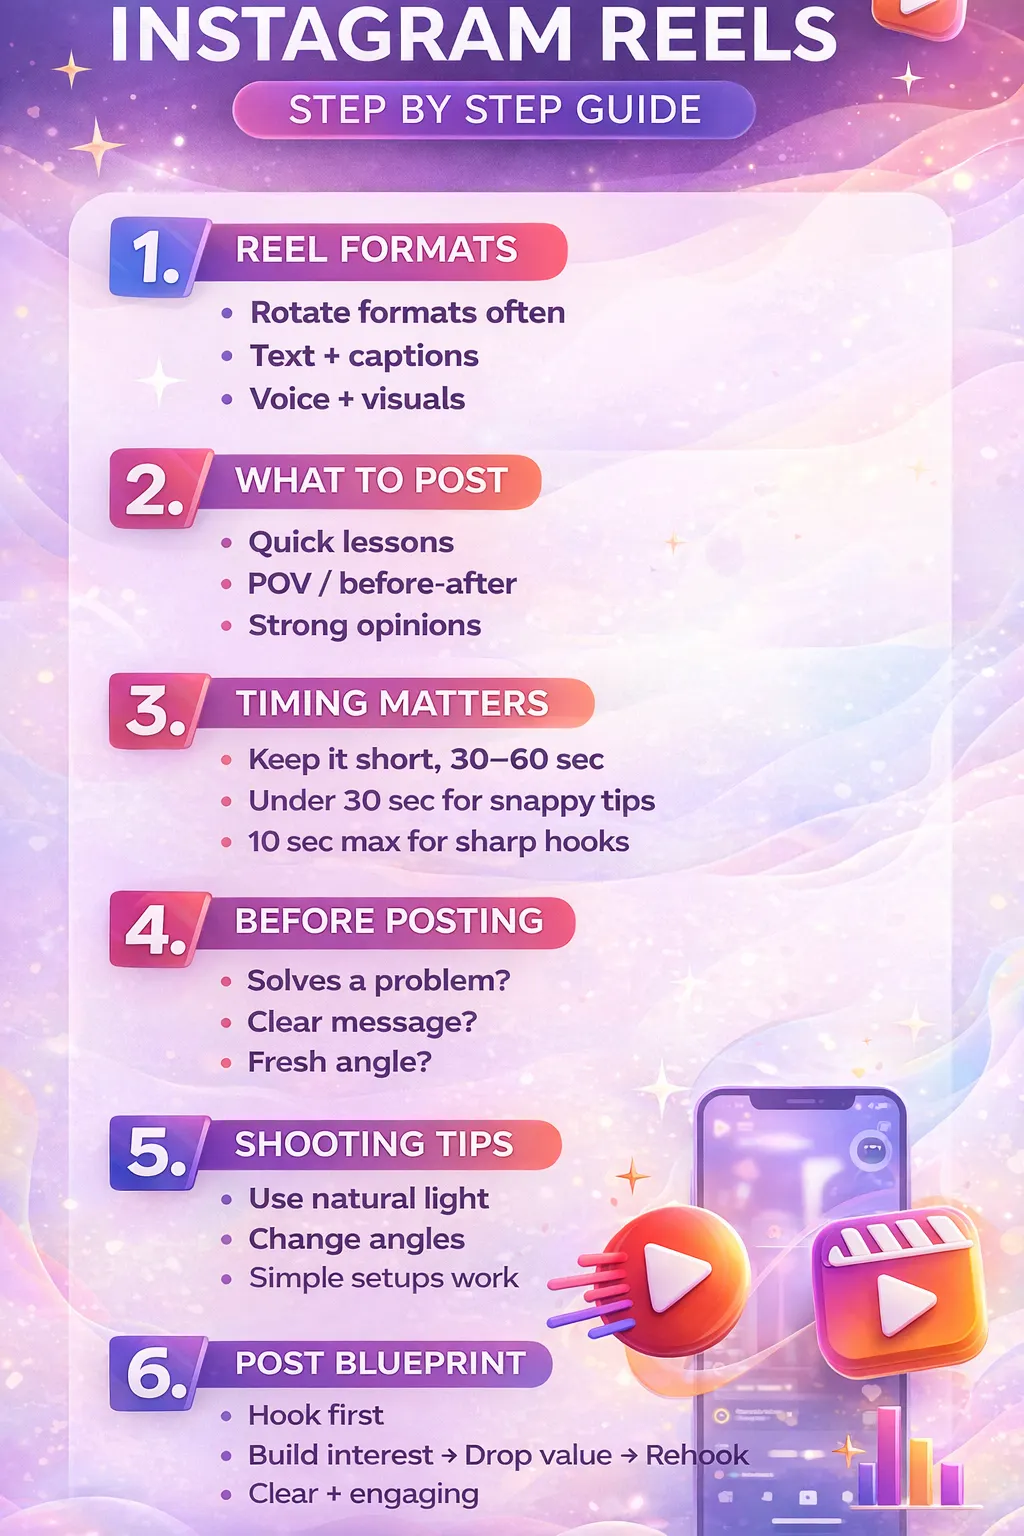
This Reels cheatsheet explains how to create short-form videos that attract attention and increase chances of going viral by focusing on clarity, value, and authenticity.
-
It highlights effective reel formats, including text-based content, voice with visuals, and face cam videos that consistently deliver value.
-
The guide emphasizes posting clear, problem-solving content such as quick lessons, strong opinions, POVs, and before-after transformations.
-
It stresses the importance of timing, recommending short durations, fast edits, captions, and simple shooting techniques using natural light.
-
Finally, it outlines a proven post blueprint: hook viewers first, build interest, deliver value, and rehook to maximize engagement.
Introduction
Short-form video content has become one of the most powerful tools for growth on social media, and Reels sit at the center of this shift. This cheatsheet breaks down the core elements that help reels perform better, gain reach, and hold attention. Every section focuses on clarity, simplicity, and value - because viral content is rarely complicated, but it is always intentional.
1. REEL FORMATS
Choosing the right reel format plays a major role in how audiences consume and engage with your content. Instead of sticking to one style, rotating formats keeps your profile fresh and prevents content fatigue.
Rotate formats often
Using the same style repeatedly can reduce engagement over time. Rotating formats allows your content to appeal to different audience preferences while keeping your feed dynamic and interesting.
Text + captions
Text-based reels work well for viewers who scroll without sound. Clear on-screen text paired with captions helps communicate the message instantly and ensures the content is accessible and easy to consume.
Voice + visuals
Combining voiceovers with relevant visuals creates a more immersive experience. This format allows you to explain ideas clearly while reinforcing them visually, making the message more memorable.
Face cam + value
Showing your face builds trust and authenticity. When paired with useful information or insights, face cam reels feel more personal and relatable, helping audiences connect with the creator behind the content.
2. WHAT TO POST
Knowing what type of content to post removes guesswork and increases consistency. The focus here is on delivering value in a clear and engaging way.
Quick lessons
Short, actionable lessons perform well because they respect the viewer’s time. Delivering one clear takeaway per reel makes the content easy to understand and share.
Strong opinions
Strong opinions spark conversation and engagement. Taking a clear stance helps your content stand out while encouraging viewers to react, agree, or challenge your perspective.
POV
POV-style content allows you to share experiences or viewpoints in a direct and personal way. This format feels authentic and often resonates deeply with specific audiences.
Clear value
Every reel should offer something useful - whether it’s knowledge, insight, or inspiration. Clear value ensures viewers feel their time was well spent.
Before → After
Transformation content works because it shows progress clearly. Before-and-after reels visually demonstrate results, making the impact of the message easy to understand.
3. TIMING MATTERS
Reel length directly affects retention and performance. Keeping content concise improves watch time and completion rates.
Aim for: 30–60 seconds
This range allows enough time to explain ideas clearly while still holding attention. It works well for educational and value-based content.
Under 30 seconds
Shorter reels are easier to consume and replay. They are ideal for quick tips, opinions, or punchy insights.
10 seconds max
Ultra-short reels force clarity. When the message is sharp and focused, very short videos can be highly effective and engaging.
4.BEFORE POSTING
Before publishing a reel, reviewing a few key points can significantly improve its performance and clarity.
Solves a problem?
Content that addresses a real problem is more likely to be saved, shared, and appreciated by viewers.
Clear message?
A reel should communicate one main idea. If the message feels confusing, it’s harder for viewers to stay engaged.
Fresh angle?
Even common topics perform better when presented from a new or unique perspective. A fresh angle helps your reel stand out in crowded feeds.
Feels real?
Authenticity matters. Content that feels genuine builds trust and long-term audience connection.
5. SHOOTING TIPS
High-performing reels don’t require complex setups. Simple shooting techniques can significantly improve video quality.
Use natural light
Natural light enhances clarity and reduces the need for heavy editing. It creates a clean and professional look with minimal effort.
Change angles
Switching angles keeps visuals engaging and prevents the video from feeling static or repetitive.
Close + wide shots
Mixing close and wide shots adds depth and variety, making the reel more visually interesting.
Simple setup works
Overcomplicating setups can slow down content creation. Simple setups allow for faster production and consistency.
6. EDIT TO WIN
Editing determines how engaging a reel feels. Clean, simple edits help maintain flow and viewer attention.
Cut fast
Fast cuts remove unnecessary pauses and keep the pace engaging. This helps maintain retention throughout the reel.
Add captions
Captions improve accessibility and ensure the message is clear even without sound.
Skip heavy effects
Heavy effects can distract from the message. Simple edits keep the focus on content rather than visuals.
Light zooms only
Subtle zooms add movement without overwhelming the viewer. They enhance emphasis naturally.
Soft music
Soft background music supports the mood without overpowering the main message.
7. POST BLUEPRINT
Every successful reel follows a simple structure that guides the viewer through the content.
Every reel need this
Consistency in structure helps audiences know what to expect while keeping them engaged.
Hook first → Build interest → Drop value → Rehook
Start by grabbing attention immediately. Then build curiosity, deliver clear value, and end with a rehook that encourages viewers to stay, rewatch, or engage.
Conclusion
Reels perform best when they are simple, clear, and focused on delivering real value to the viewer. By choosing the right formats, keeping content concise, and following a strong posting structure, creators can consistently improve reach and engagement. This cheatsheet provides a practical framework to create reels that feel authentic and are designed to hold attention from start to finish.