TL;DR: The Quick, No-Nonsense Breakdown
If you're grabbing a coffee and only have two minutes, here is the absolute bottom line about Instagram Story navigation in 2026:
- What is it? Navigation isn't about GPS. It’s the specific trackable actions users take with their thumbs while watching your Instagram Stories (Taps Forward, Taps Back, Next Story, and Exited).
- Why should you care? These numbers are literal feedback from your audience. They tell you precisely what makes them stay glued to their screen and what makes them run away.
- The MVP Metric: "Taps Back." If someone goes backward to rewatch a slide, the Instagram algorithm flags your content as high-value gold.
- The Red Flag Metric: "Exited." This means your Story was the exact reason they closed the app entirely. Ouch.
- The 2026 Playbook: Stop posting blindly. Use these insights to figure out what your audience loves, give them more of it, and then use smart DM automation tools to turn those highly engaged viewers into paying clients.
Introduction: The Brutal Reality of Instagram Stories
Picture this: It’s Tuesday afternoon. You’ve just spent the last 45 minutes meticulously designing a five-part Instagram Story sequence. You found the perfect trending audio, adjusted the lighting, typed out engaging captions, and carefully placed your stickers so they don't block anything important. You hit "Add to Story" and feel pretty good about it.
Fast forward 24 hours. The Stories are about to expire. You tap the screen to check the damage, and your heart sinks. Slide one has 3,000 views. Slide two has 1,200. By slide five? You’re staring at a measly 400 views.
Where did everybody go? Did they get bored? Did they hate the font? Did they swipe away to watch a dog video instead?
It is incredibly frustrating to pour your energy into content creation only to watch your audience ghost you halfway through. If you want to understand exactly why your followers are sticking around—or why they are bailing on you faster than a bad blind date—you need to stop staring at that little eye icon in the corner. You need to look at your "Navigation" metrics.
But what does navigation actually mean on Instagram?
In plain, non-technical English, navigation is a category inside your Instagram Insights that tracks the physical gestures a viewer makes while your Story is on their screen. It tells you if they are impatiently skipping ahead, going backward to re-read your text, swiping to the next creator's profile, or just closing the app entirely.
By learning to read these silent signals, you can pinpoint exactly what kind of content hooks your specific audience. You stop guessing. You start knowing. Let’s break down exactly what these numbers mean, how to read them without needing a math degree, and how you can use them to turn casual scrollers into highly engaged, loyal followers this year.
1. Demystifying Instagram Insights: Beyond the View Count
For as long as Instagram Stories have existed, creators, influencers, and digital marketers have been absolutely obsessed with the view count. It’s a rush to see that number climb. But here is a tough pill to swallow: views are lying to you.
The Danger of Relying on Vanity Metrics
In the marketing world, we call views a "vanity metric." It looks great on a screenshot, it makes you feel popular, but it doesn't actually translate to business success. A single "view" simply means that your Story loaded on a user's screen for a fraction of a second.
It doesn't tell you if they actually read the long paragraph you typed out. It doesn't tell you if they watched your talking-head video with the sound on. Most importantly, it doesn't tell you if they immediately tapped their screen to skip past you because they found the content boring. Judging the success of your Instagram by your view count is like judging the quality of a restaurant by how many people walk past the front window. You need to know how many people actually sat down, ate the meal, and asked for dessert.
The Massive 2026 Algorithm Shift Toward Retention
We are deep into 2026, and the Instagram algorithm has evolved. It is more ruthless and sophisticated than ever before. The platform has one singular goal: keep users on the app for as long as humanly possible so they can show them more ads.
Instagram doesn't care how many followers you have anymore. It cares about retention. If your Stories consistently make people close the app, Instagram is going to shadow-demote your profile, pushing your little circle all the way to the back of your followers' feeds where no one will ever see it. Conversely, if your content keeps people tapping, reading, and interacting, Instagram will reward you by putting you at the very front of the line. Understanding your navigation metrics is literally the only way to play this retention game and win.
This video clarifies the "Navigation" metric on Instagram, which specifically tracks how users interact with your Stories.
2. What Does “Navigation” Actually Mean on Instagram?
Let's get crystal clear on the actual definition so you know exactly what you're looking at when you open your dashboard.
The Literal Definition of the Metric
When you open your Professional Dashboard and dig into your Story insights, you will find a dedicated section labeled "Navigation." Navigation refers to the collective data points that track the physical screen taps and swipes a user makes while viewing a specific slide.
It is the overarching category that groups together four specific actions. Think of it as a behavioural report card for every single 15-second block of content you post.
Viewing It Through the Algorithm's Eyes
Imagine the algorithm sitting in a control room, watching how users react to your content. You post a photo. The algorithm watches. Do users stare at it for five seconds? Do they instantly tap right? Do they swipe left?
Navigation is essentially a silent conversation between you and your audience. You are putting a piece of media out into the world, and their thumbs are giving you immediate, brutally honest feedback. If you learn to speak this language of taps and swipes, you'll never have to guess what your audience wants to see ever again.
To stop losing potential customers after they click your ads, you can implement this guide to optimizing Instagram navigation and learn how to guide visitors from your profile bio to a final purchase.
3. The Four Pillars of Story Navigation Explained
To truly master your analytics, you need to understand the four core pillars that make up the navigation section. These four specific actions dictate your overall completion rate.
Complete Breakdown of Instagram Story Actions
| The Navigation Action | What the User Did | What It Actually Means | How the Algorithm Judges You |
|---|---|---|---|
| Forward | Tapped the right side of their phone screen. | They skipped to your next slide before the timer ran out. | Neutral. Often depends on how fast they tapped. |
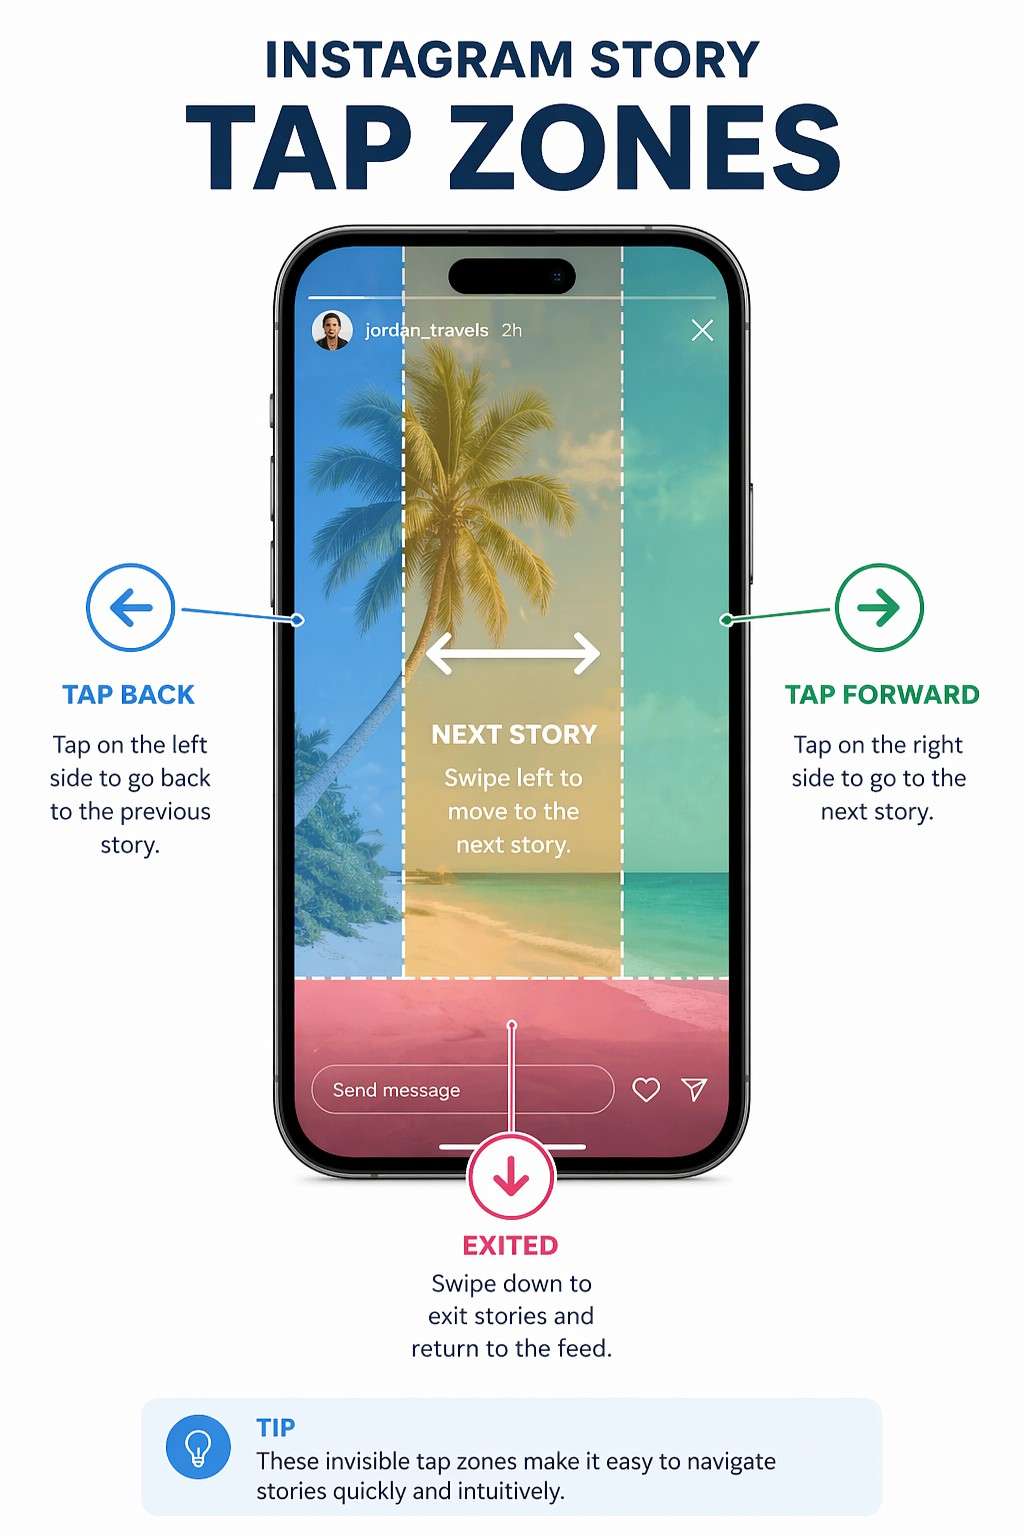
| Back | Tapped the left side of their phone screen. | They intentionally went backward to rewatch the previous slide. | Highly Positive. Signals deep interest and high value. |
| Next Story | Swiped horizontally left across the screen. | They got bored and skipped your entire profile to see someone else. | Negative. You lost their attention completely. |
| Exited | Swiped down or closed their phone. | They left the Instagram Stories feed entirely. | Highly Negative. Your content caused them to quit the app. |
Understanding this table is the foundation of everything we are going to talk about next. Keep these definitions in mind.
4. Taps Forward: Are People Bored or Just Speed-Watching?
The "Forward" metric causes more unnecessary panic than any other number in the Insights dashboard. When you pull up a slide and see 1,500 taps forward, your stomach drops. You immediately assume, "Wow, everyone hated this slide so much they skipped it."
But let's take a deep breath and look at user behaviour in the real world.
The Psychology of the Impatient Speed-Tapper
The modern social media consumer has an attention span shorter than a goldfish. They do not have the patience to sit and watch a static photo for a full 15 seconds. Many users are what we call "speed watchers". They quickly scroll through their entire story feed, like a machine gun, until something colourful or interesting catches their attention.
A high "Tap Forward" rate isn't always a bad thing. Let's say you post a slide with a few sentences of text. A fast reader is going to finish reading that text in three seconds. What are they going to do for the remaining 12 seconds? They aren't going to just stare at the wall. They are going to tap forward to see what's next.
Context is everything.
You also have to look at the type of content you posted. If you are posting a rapid-fire sequence—like a step-by-step recipe, a workout progression, or tapping to the beat of a song—you want people to tap forward. That's the whole point of the sequence.
You should only raise the alarm on taps forward if they are followed by a significant drop in views on the subsequent slide. If they tap forward and keep watching, you're fine. If they tap forward and subsequently leave, it indicates that your content is not resonating with them.
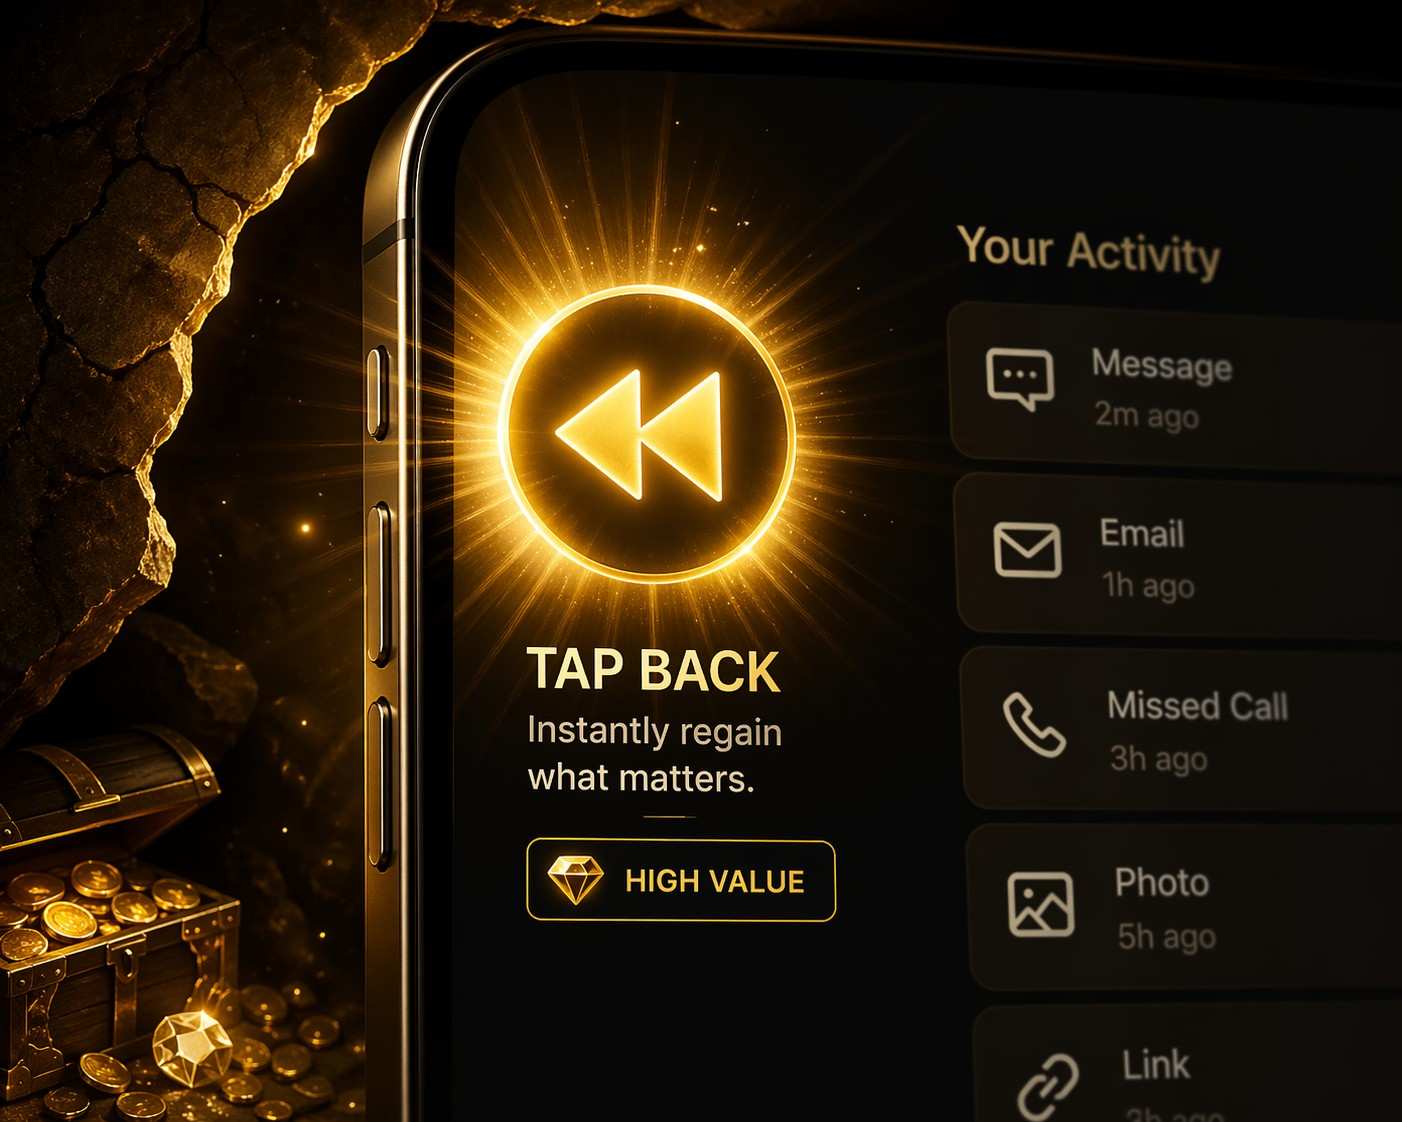
5. Taps Back: Why This is Your Most Valuable Metric
If you want to make the 2026 Instagram algorithm fall in love with your profile, this is the number you need to obsess over, print out, and hang on your wall. "Taps Back" occurs when a user physically taps the left side of their screen to rewatch the slide they were just looking at.
Decoding High Intent and Deep Interest
Think about your own behavior on the app. How often do you bother to go backward? It’s rare, right? It actually requires effort to break your forward scrolling momentum.
When a user taps back on your Story, they are making an active, conscious choice to re-engage with you. It means they saw something visually stunning, read a piece of advice so valuable they needed to screenshot it, or missed a tiny detail they desperately wanted to catch.
This sends a massive, glaring green light to the Instagram algorithm. It screams, "This creator's content is so incredibly good that people are literally watching it twice." Stories that trigger a high tap-back rate are almost guaranteed to be bumped to the front of the line the next time you post. This is the holy grail.
6. The Difference Between “Exited” and “Next Story”
These two metrics are the bad guys. They are the villains of your Instagram Insights. However, they tell two very distinctly different stories about exactly how and why you lost your audience's attention.
The Brutal "Next Story" Swipe
A "Next Story" swipe happens when a user takes their thumb and physically swipes horizontally across the screen. They aren't just skipping to your next slide; they are skipping you. They are moving on to the next account in their queue.
What does this mean for you? It means they are still in the mood to watch Instagram Stories, they just aren't in the mood to watch yours. This usually happens when you are rambling, when your sequence drags on for way too many slides, or when you suddenly switch topics from something interesting to something highly promotional and boring.
The Devastating "Exited" Hard Close
"Exited" is the harshest metric on the platform. This happens when the user swipes down to return to the main grid feed, clicks an external link in your bio, or just locks their phone screen and walks away.
Now, let's be fair—sometimes an exit has absolutely nothing to do with you. The user's lunch break ended, their boss walked into the room, or their Uber arrived. You can't control that. But, if you are looking at your stats and you see an abnormal, massive spike in exits on one specific slide, it's a huge red flag. It usually means that specific piece of content was annoying, offensive, or so aggressively salesy that it actively pushed the viewer off the app entirely.
To better understand your audience's behaviour, you can read this guide on Instagram navigation explained and learn how to use story metrics like forward taps and exits to refine your content strategy.
7. The "Good Exit" Phenomenon: When Losing Viewers is Actually the Goal
Let's address a massive blind spot that sends perfectly good digital marketers into a total panic. You pull up your analytics on a highly promotional Story slide. You see 400 "Exited" metrics staring back at you. Your immediate reaction is to assume your sales pitch was so annoying that 400 people threw their phones across the room.
Stop. Look closer at the slide you actually posted.
Did that specific video include a clickable Link Sticker? Did you tag another brand partner? Did you verbally tell your audience to "click my profile picture to read the bio"?
If the answer is yes, those aren't rage-quits. Those are actual, hard conversions. Instagram’s tracking system is incredibly literal. Because the user tapped a link that pulled them off the native Story viewer—either opening an external web browser or redirecting them to your main grid—the system strictly categorizes that action as an "Exit."
To figure out if your content is actually bombing or secretly printing money, you have to cross-reference your Navigation tab with your Interactions tab. If you show 400 Exits and 385 Link Clicks, you didn't fail. You successfully pushed high-intent traffic exactly where you wanted it to go.
8. The Secret Algorithm Math: Taps Back vs. Impressions
Here is the brutal reality about how Meta’s backend actually evaluates your profile. Raw navigation numbers mean absolutely nothing in a vacuum.
If you get 50 "Taps Back," you might feel like a genius. But if that Story had 15,000 total impressions, 50 taps is a statistical rounding error. The 2026 algorithm doesn't care about the raw count; it exclusively grades you on a percentage curve. It constantly calculates your interaction ratios.
You need to aim for a Taps Back to Impression ratio of at least 2% to 3%. If you can consistently hit that specific mathematical threshold, the algorithm classifies your profile as a "high-retention creator" and permanently boosts your baseline organic reach.
9. The "Sticker Trap" Hack to Interrupt Muscle Memory
Your absolute biggest enemy on Instagram isn't the algorithm. It is human muscle memory.
People do not watch Stories intentionally anymore. They zombie-scroll. They sit on the couch and subconsciously tap the right side of their screen to fast-forward through their feed without actually processing what they are looking at. You have to literally interrupt their thumb to break the trance.
The Fix: Take an interactive sticker—like a poll or a sliding emoji scale—and place it strategically on the middle-right side of your screen.
Why? Because that is the exact physical zone where users aggressively tap to skip forward. When they try to speed-tap past your slide, they accidentally hit the poll instead. This physical interruption snaps them out of their autopilot scrolling. It forces them to stop, look at the screen to see what they just clicked, and actually digest your content. It completely kills the "Next Story" swipe reflex and drastically lowers your skip rate with zero extra creative effort.
10.Where to Find Your Navigation Stats Hidden in the App
Instagram isn't exactly making it easy to find these numbers. They keep pushing reach and likes to the forefront because they look prettier. You have to be willing to do a little menu-diving to find the good stuff.
Here is exactly how to uncover your hidden navigation data right now:
- Open Up Your Profile: Launch the app and tap your little face in the bottom right corner.
- Enter the Dashboard: Tap the button that says "Professional Dashboard" right under your bio, or hit the three horizontal menu lines in the top right and tap "Insights".
- Find Your Content: Tap on the section labeled "Content You Shared" and filter it specifically to "Stories".
- Change the Filter: By default, Instagram usually shows you "Reach" or "Impressions". Tap that drop-down menu at the top of the screen. Scroll past the basic stuff until you find the dedicated "Navigation" category.
- The Quick Swipe Method: If you don't want to dig through menus, just go watch your own live Story (or pull one up from your archive). Swipe up directly on the screen. This instantly pulls up the granular data for that specific slide, showing you exactly how many people went forward, back, exited, or moved on.
This video highlights a major interface update on Instagram that introduces a more intuitive swipe-based navigation system, allowing users to access Reels and DMs from anywhere in the app.
11. Content Tweaks to Fix High Drop-Off Rates
Alright, so you’ve found your numbers, and they are terrifying. Everyone is abandoning your second slide, resulting in a low completion rate. How do we fix these issues? We need to fundamentally change how you structure your content.
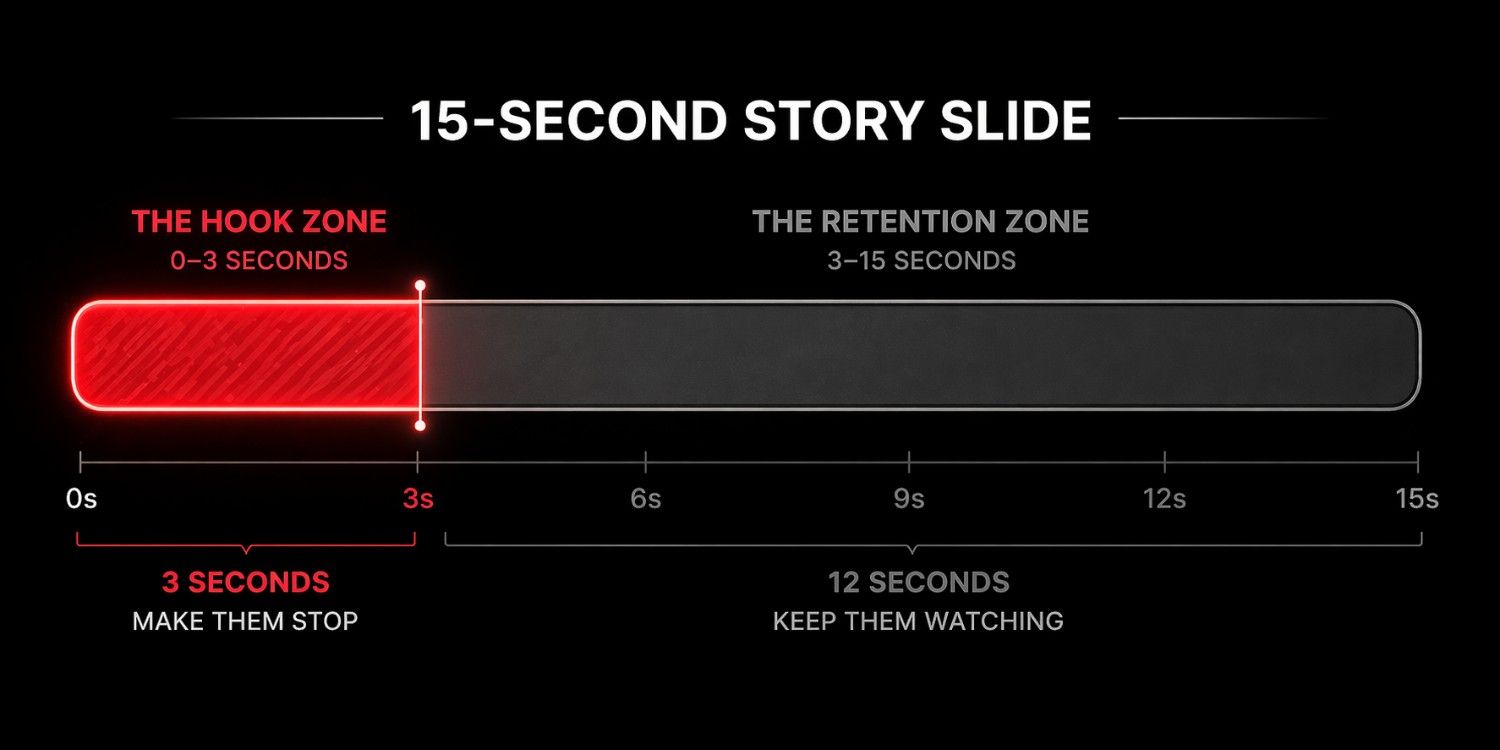
Mastering the 3-Second Rule
The first three seconds of your story sequence are make-or-break. If you lose them here, you never get them back.
If you are doing a talking-head video, you have to ditch the boring introductions. Stop saying, "Hey guys, happy Tuesday. I hope you're having a great week, so I was just driving to the gym and I was thinking..."
No one cares. They are already swiping.
You need to hook them instantly. Start with the payoff. Say something like, "Here is the exact reason your Facebook ads are burning your money right now." Boom. You have their attention.
Visual Interruptions
If you are talking for more than 15 seconds, you need to add visual interruptions. People watch stories with the sound off while they are in meetings. If you don't use the native closed-caption sticker, they will swipe away. Add text boxes highlighting key words. Use GIFs. Zoom in and out quickly. Change your camera angle. You have to constantly re-engage their eyes to keep their thumbs from swiping away.
12. Story Sequencing: How Many Slides is Too Many?
We need to talk about viewer fatigue. We have all seen it—you tap on an influencer's profile and look at the top of the screen, and instead of a few clean dashes, the progress bar looks like a hundred tiny grains of sand. You immediately sigh and swipe away, right? It’s just too overwhelming.
Finding the Goldilocks Zone
You may have a truly remarkable, transformative story to share, but posting 30 consecutive slides will likely cause people to lose interest.
Data going into 2026 shows that the absolute sweet spot for a daily Story sequence is between 3 to 7 slides per sitting. That is enough real estate to create a clear beginning (the hook), middle (the value), and end (the call to action) without overwhelming the viewer's short attention span.
If you are at an event or have a lot of behind-the-scenes content to share, don't dump 20 slides at noon. Space them out. Post four slides with your morning coffee. Post four more at lunch. Post the final four in the evening. This not only prevents viewer fatigue and keeps your exit rates low, but it also hacks the algorithm by bumping your profile ring back to the very front of your followers' feeds three different times in one day.

13. Engagement Hacks to Keep Viewers Tapping Back
Since we've established that "Taps Back" is the ultimate goal, let's talk about how to reverse-engineer your content to make it happen naturally without begging your audience to do it.
- The "Blink and You'll Miss It" Flash Text: Add a tiny, almost hard-to-read text box in the corner of your video. Make it a funny side-joke, a secret promo code, or an extra tip. The viewer will catch a glimpse of it just as the slide transitions, forcing them to violently tap back so they can pause the screen and read what it said.
- The Rapid Before-and-After: Never put a before-and-after photo side-by-side in one slide. Put the "Before" on slide two, and the "After" on slide three. Human nature will force the viewer to tap back and forth repeatedly to spot the differences and admire the transformation.
- Split Context Interactive Stickers: Put a poll on slide number two ("Which of these logo colors do you prefer?"), but put the actual image of the logos on slide number one. People will inherently tap back to double-check the image before they lock in their vote.
- The Information Overload Screenshot: Share a highly valuable bulleted list or a complex infographic. Tell people verbally, "Screenshot the next slide for your records." They will prepare for it, miss it, and have to tap back to successfully grab the screenshot.
14. Turning High Story Retention into Direct Conversions
So, you’ve put these tactics into play. You are looking at your analytics and you are seeing your retention skyrocket. Your taps back are high, your exits are practically non-existent. Congratulations, you have successfully captured human attention.
But attention doesn't pay the rent.
The Modern Call-to-Action
Once your metrics prove that your audience is highly engaged, it’s time to monetise that trust. You can’t just let good engagement sit there doing nothing. You have to tell your audience exactly what their next step is.
The old way of doing this was yelling, "Link in bio!" But we know from looking at our "Exited" stats that forcing people to leave your story to go click your bio link causes massive drop-offs. The new, much more effective strategy is driving viewers straight into your direct messages.
End your high-retention story sequence with a clear, simple command: "Reply to this story with the word 'GUIDE' to get my free marketing playbook."
You don't have to suffer through typing 500 replies a day when your views are high. This is where you bring in a reliable automation tool, like InstantDM. By setting up a quick auto-reply, the software simply catches anyone who types your keyword and instantly fires the link directly into their inbox. You get to keep your audience engaged, deliver value instantly, and save yourself hours of tedious screen time.
To better understand how your audience interacts with your daily updates, you can read this guide on what navigation means on Instagram Stories and how to track specific metrics like back taps and exits.
15. How to Capture Leads Without Leaving the App
Let's delve deeper into this concept. When you look at your navigation stats, the people who make it to the very last slide of your 5-part sequence without swiping away are not casual scrollers. They are your warmest, most highly invested leads.
Removing the Friction from Lead Gen
As marketers, our ultimate goal is always to move these highly engaged followers off borrowed land (Instagram) and onto an asset we actually own, like an email list or a dedicated WhatsApp community. If Instagram's algorithm changes tomorrow, you still have their contact info.
But traditional lead generation is clunky. You tell them to click a link, they wait for a slow mobile webpage to load, they try to type their email on a tiny keyboard, they get frustrated, and they leave. Every step adds friction.
The smarter move is to capture their information right where they already are: inside the chat. Using a visual flow builder, such as the one InstantDM provides, lets you build a totally seamless experience. A user replies to your Story, the automated chat friendly asks for their best email address, the user types it naturally into the DM conversation, and the software automatically funnels that data straight into your CRM spreadsheet. No slow websites. No friction. Just a smooth conversation that captures leads while you are literally asleep.
16. Industry Benchmarks: What Does a "Good" Navigation Rate Look Like?
It is incredibly easy to drive yourself crazy staring at percentages and wondering if you are doing a good job. What is normal? What is terrible? While numbers can fluctuate wildly depending on whether you are a local bakery or a global fashion brand, here are the realistic 2026 benchmarks you should be aiming for.
The Analytics Checkup
- Your Completion Rate (The Ultimate Test): To find this, take the view count of your very last slide and divide it by the view count of your very first slide. If you are retaining 70% to 80% of your audience all the way to the end of a 4-slide sequence, you are absolutely crushing it.
- The Next Story Rate (The Boredom Meter): You want to try and keep this below 15%. If more than 15% of your viewers are actively swiping horizontally to get away from your profile, your content is too long, too repetitive, or just plain irrelevant to why they followed you in the first place.
- The Tap Forward Rate (The Speed Bump): It's important to monitor this percentage, especially if it increases alongside your exits. A 60% or even 70% tap-forward rate is completely normal behaviour for users looking at photo-based Stories. People read fast. Let them tap.
Conclusion: Stop Guessing and Start Growing
Understanding what navigation actually means on Instagram is the closest thing you will ever get to reading your audience's minds. It takes the emotional guesswork completely out of your content creation process. Every single tap forward, every rare tap back, and every painful exit is a piece of direct, unfiltered feedback from the people you are trying to reach.
They are telling you exactly what they want more of, and exactly what they are sick and tired of seeing.
By keeping a close eye on these specific metrics, you can refine your storytelling skills, drastically lower your drop-off rates, and keep viewers hooked from the very first slide to the absolute last. And once you have their undivided attention? Stop letting it sit idle. Start leveraging smart DM strategies and reliable automation to turn those screen taps into meaningful relationships and actual revenue. Stop staring at your view count. Go check your navigation insights today, tweak your next sequence, and watch your brand grow.
Next Steps and Related Content
Once your Instagram DM automated lead generation system is up and running, you can use these connected resources to maximise its effectiveness and enhance your results:
- The Complete Guide to Instagram Comment-to-DM Automation (2026)
- How to Set Up Auto DM on Instagram: A Step-by-Step Guide for 2026
- A Comparison of the Best Instagram DM Automation Tools (2026)
- How to Use Claude AI to Automate Your Instagram DMs
- Beyond Instagram: The Power of DM Automation in Marketing