What’s the Best Way to Track Instagram Follower Count Changes Over Time for Indian Creators (2026)?
Direct answer: Use a three-layer system. Layer 1 is Instagram Insights for official 90-day follows, unfollows, and Reel-level attribution. Layer 2 is a free public-history tool such as Social Blade or TrendHERO for multi-year shape and competitor checks. Layer 3 is a private weekly Google Sheet that records velocity, the content that caused the change, and the India event behind it (IPL, Onam, Diwali, cleanup). No single tool covers history, accuracy, quality, and cost at once.
Why follower history beats today’s count
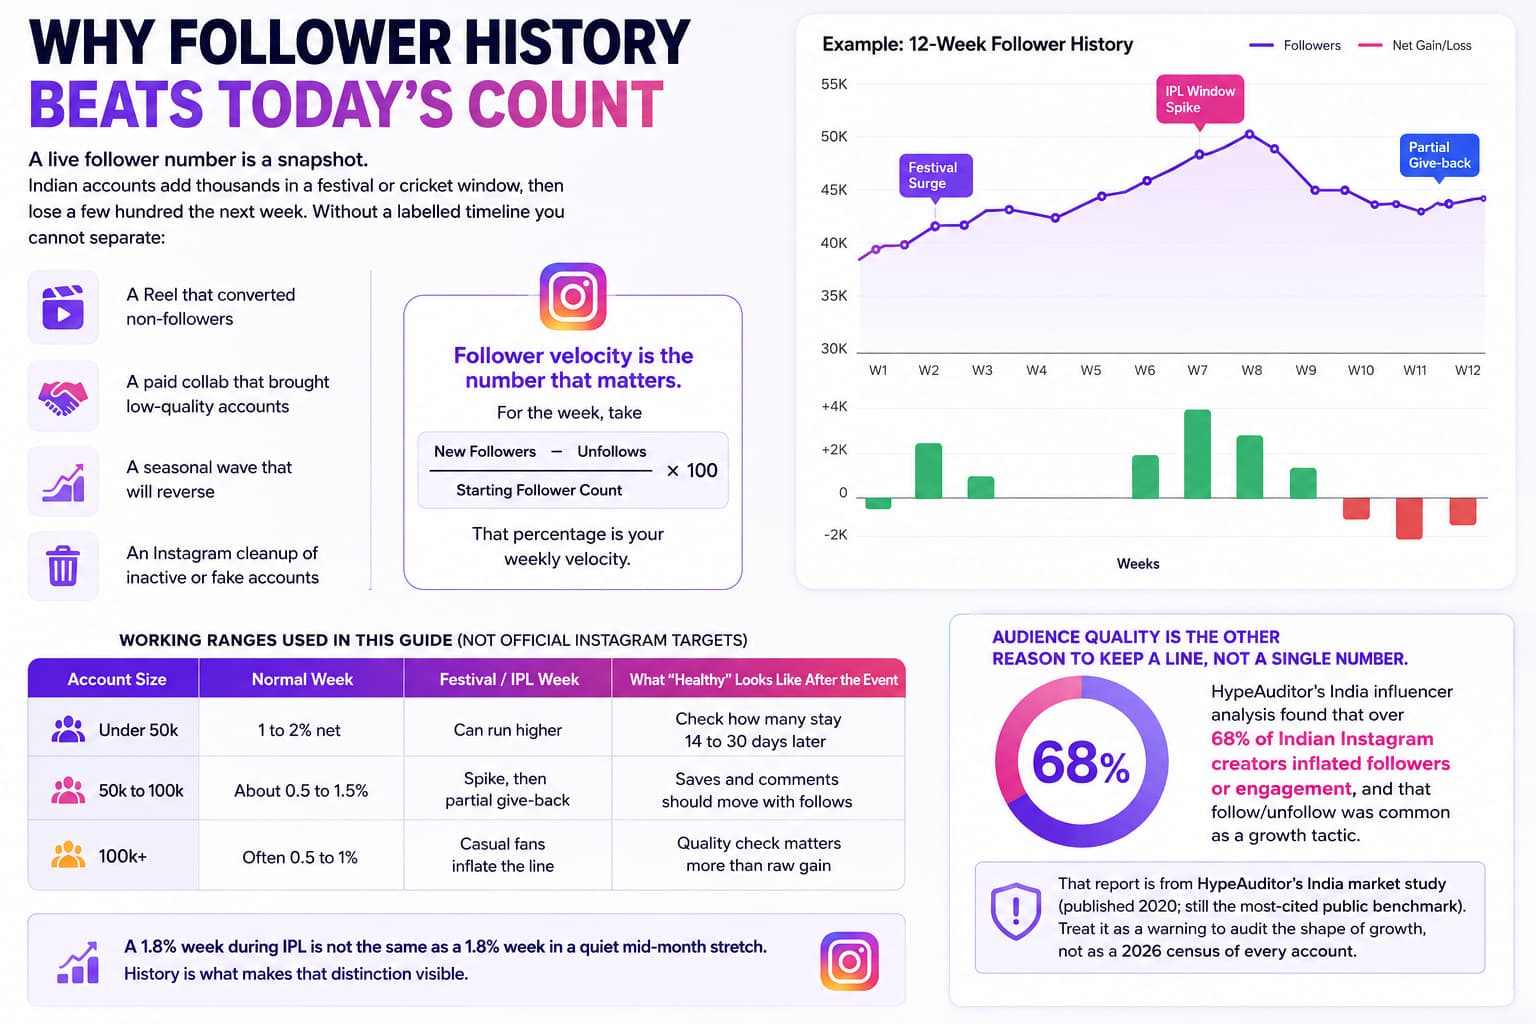
A live follower number is a snapshot. Indian accounts routinely add thousands in a festival or cricket window, then lose a few hundred the next week. Without a labelled timeline you cannot separate:
- A Reel that converted non-followers
- A paid collab that brought low-quality accounts
- A seasonal wave that will reverse
- An Instagram cleanup of inactive or fake accounts
Follower velocity is the number that matters. For the week, take new followers minus unfollows, divide by the starting follower count, then multiply by 100. That percentage is your weekly velocity.
Working ranges used in this guide (not official Instagram targets):
| Account size | Normal week | Festival / IPL week | What “healthy” looks like after the event |
| Under 50k | 1 to 2 percent net | Can run higher | Check how many stay 14 to 30 days later |
| 50k to 100k | About 0.5 to 1.5 percent | Spike, then partial give-back | Saves and comments should move with follows |
| 100k+ | Often 0.5 to 1 percent | Casual fans inflate the line | Quality check matters more than raw gain |
A 1.8 percent week during IPL is not the same as a 1.8 percent week in a quiet mid-month stretch. History is what makes that distinction visible.
Audience quality is the other reason to keep a line, not a single number. HypeAuditor’s India influencer analysis found that over 68 percent of Indian Instagram creators inflated followers or engagement, and that follow/unfollow was common as a growth tactic. That report is from HypeAuditor’s India market study (published 2020; still the most-cited public benchmark). Treat it as a warning to audit the shape of growth, not as a 2026 census of every account.
How far back Instagram Insights goes in 2026
Meta’s official help docs are the source of truth: account Insights can be viewed for any period inside the past 90 days, using presets (Last 7, 14, 30 days, Previous month, Last 90 days) or a custom range inside that window. The window rolls. Each new day drops the oldest day.
What Insights gives you
- Net follower change for the selected period
- Follows versus unfollows on many Professional accounts
- Content that contributed to new follows (Reel or post attribution on eligible Creator accounts)
- Audience demographics (age, gender, top cities and countries, active times) once the account has enough data (Meta notes follower trend views typically need 100 or more followers)
What Insights does not give you
- Names of who followed or unfollowed
- History older than about 90 days
- A year-over-year chart unless you saved screenshots or exports yourself
(For a plain-language walkthrough of every native Insights metric, Shopify's guide is a clean reference.) How to open it: Instagram app, then Professional Dashboard or Insights, then the date range at the top, then Total Followers or Follows. On desktop, Meta Business Suite is usually cleaner for the same metrics.
If you do only one thing this week: open Last 30 days, write the net change, and list the top 3 Reels Insights credits for new follows.
How to read Insights so the 90-day limit does not wipe your history
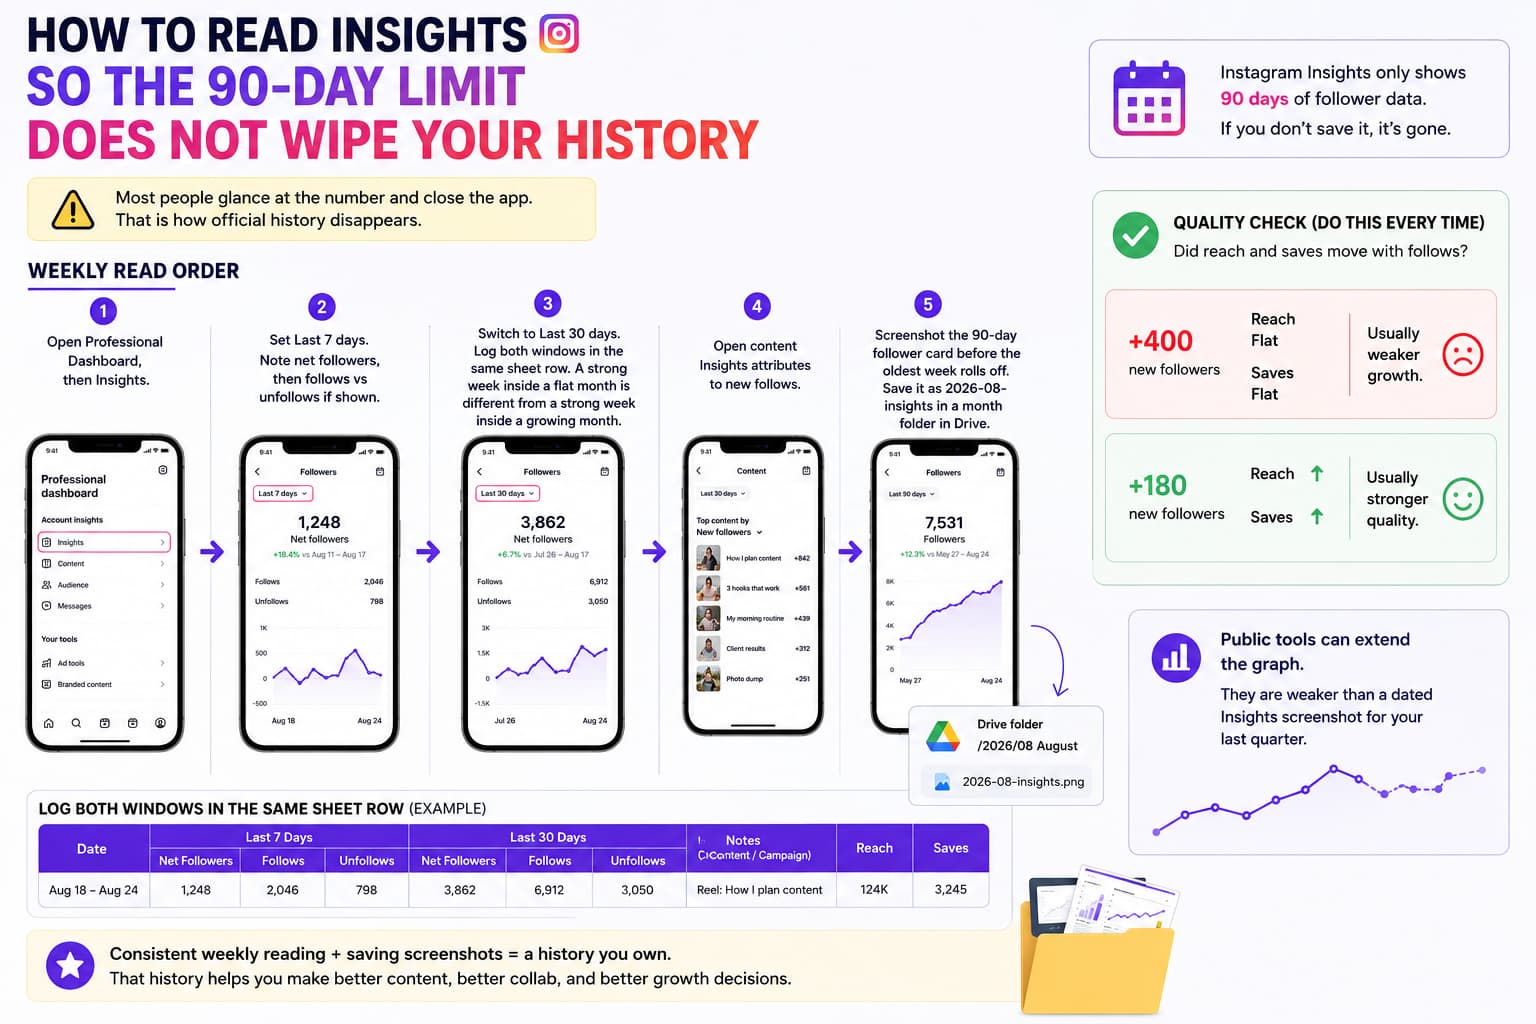
Most people glance at the number and close the app. That is how official history disappears.
Weekly read order:
- Open Professional Dashboard, then Insights.
- Set Last 7 days. Note net followers, then follows versus unfollows if shown.
- Switch to Last 30 days. Log both windows in the same sheet row. A strong week inside a flat month is different from a strong week inside a growing month.
- Open content Insights attributes to new follows.
- Screenshot the 90-day follower card before the oldest week rolls off. Save it as 2026-08-insights in a month folder in Drive.
Quality check in the same session: did reach and saves move with follows? A +400 week with flat saves is usually weaker than a +180 week where three Reels kept getting sent in DMs.
Public tools can extend the graph. They are weaker than a dated Insights screenshot for your last quarter.
The official and manual method (enough under 50k to 100k)
- Switch Personal to Creator or Business. Insights is free.
- Same day, same time each week (Sunday night works for many Indian creators). Screenshot 7-day and 30-day follower cards. Paste numbers into a Sheet.
- Add notes: posts, event (festival, collab, ad, IPL), language or city shift.
- Every 90 days, screenshot or export the longest window before it disappears.
- Optional: request Instagram’s official data download (followers and following JSON) and compare two exports locally. Do not hand the files or your password to a random “who unfollowed me” app.
This stays inside official data, costs nothing, and stores the “why” dashboards often hide.
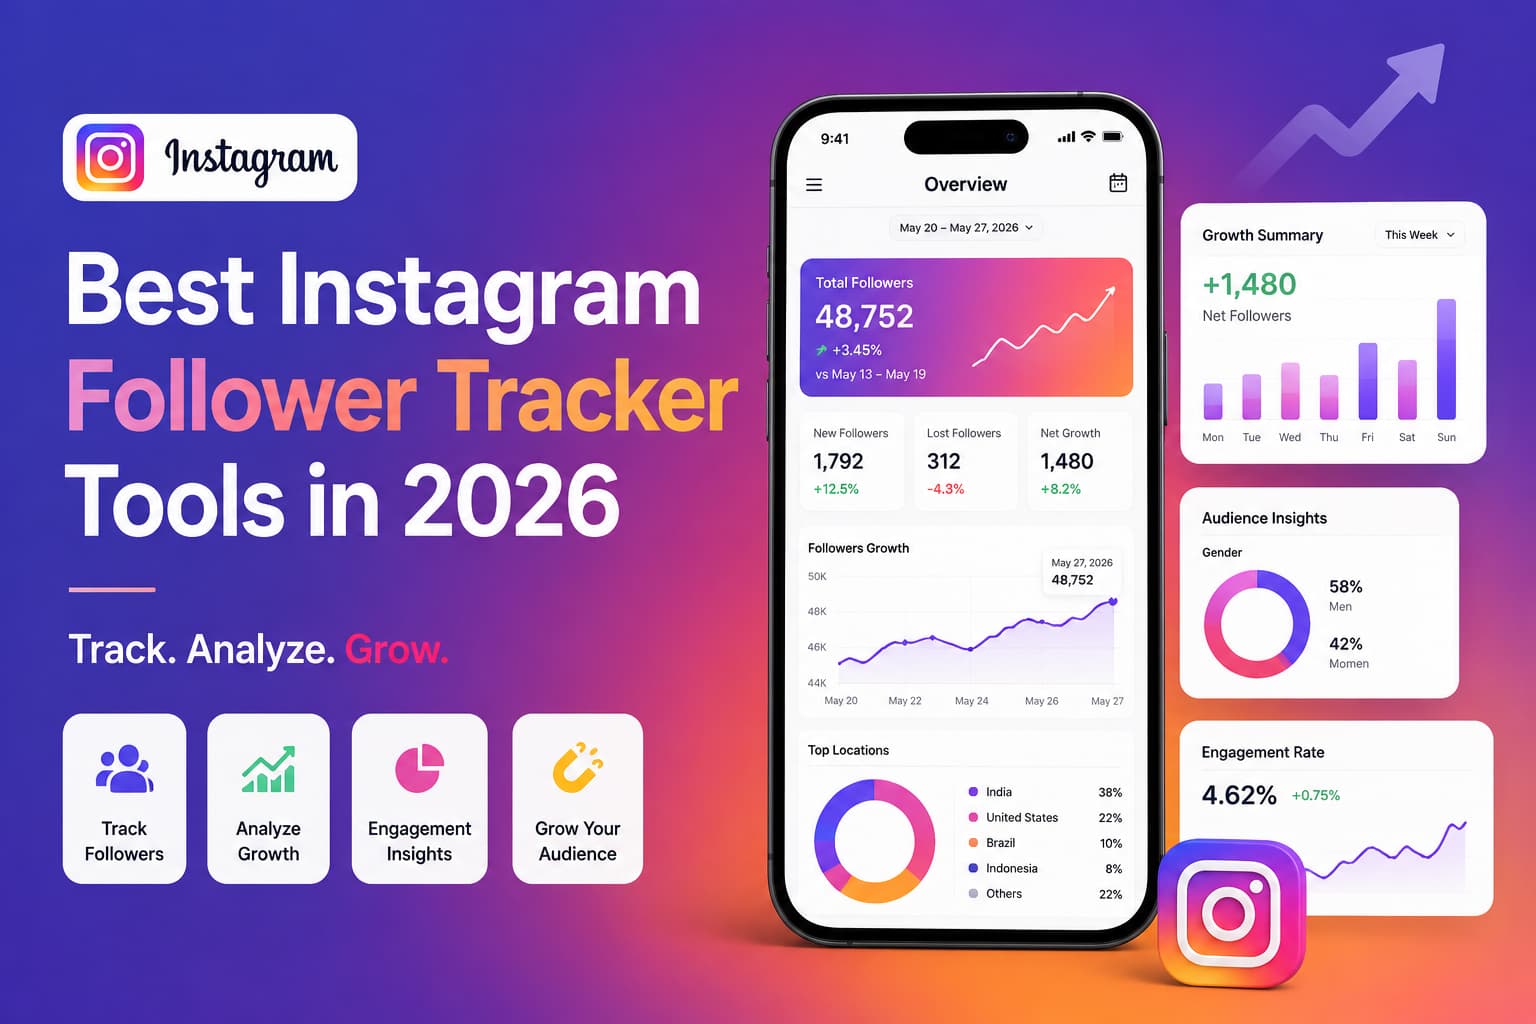
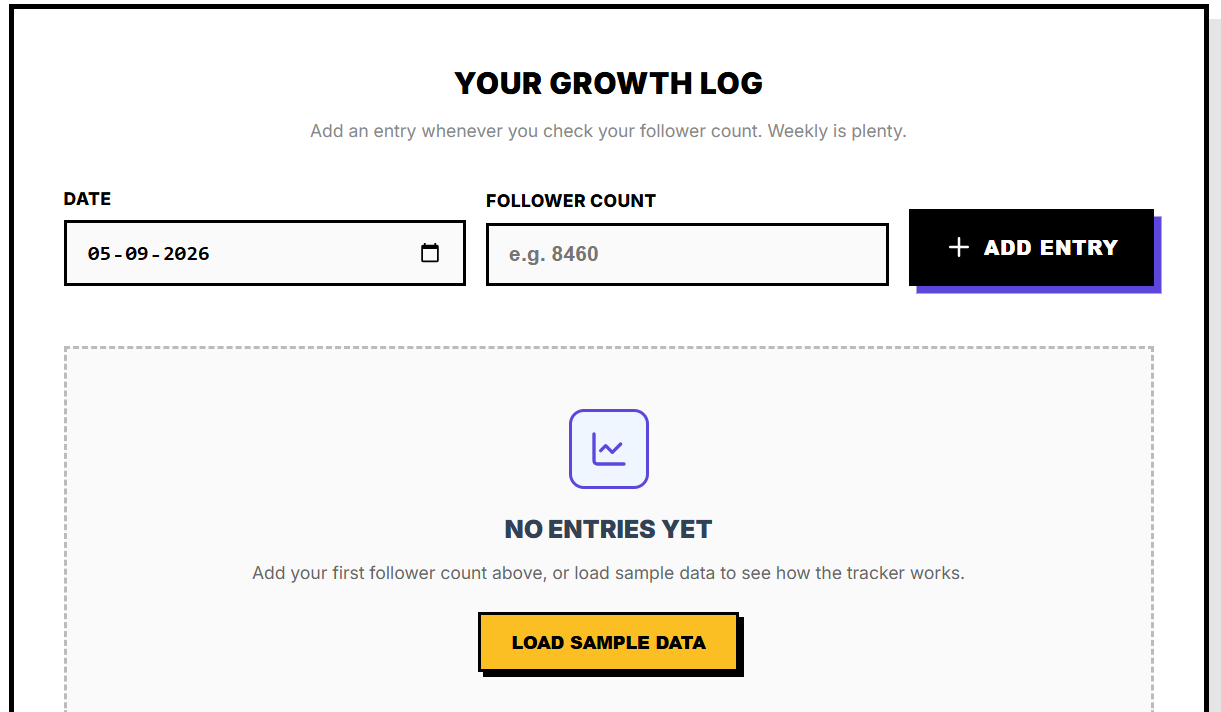
Optional shortcut: if you'd rather not build the log by hand, free browser-based tools like InstantDM's follower tracker will handle steps 2 and 3 automatically — dated entries, a growth chart, and a milestone projection. They don't replace the Event or Quality-flag columns below, so you'll still want to add those notes yourself.
What the tracking sheet should contain
| Column | Why it exists |
| Date | Same weekday each week |
| Follower count | Official Insights number |
| Net change | Follows minus unfollows when available |
| Weekly velocity percent | Makes 8k and 80k accounts comparable |
| Follows versus unfollows | Stops you celebrating junk follows |
| Top credited Reel or carousel | Ties growth to content |
| Event | IPL, Onam, Diwali, collab, boost, cleanup, none |
| City or language note | “more Chennai comments”, “Hindi Reel travelled” |
| Quality flag | real, mixed, or suspicious |
How to read one row: A 14,200-follower Coimbatore food account gains 265 in a week (1.87 percent velocity) after a 22-second Tamil Reel. Insights credits that Reel. Comments are nearby cities. Flag real. Next week: +410 after a giveaway, saves drop. Flag mixed. Brands later question the second week, not the first.
A 2 percent week at 8k is +160. The same 2 percent at 80k is +1,600. Raw gains across different sizes produce the wrong strategy.
Export CSV monthly. That annotated year is something Iconosquare cannot invent after you connect.
Third-party tools that actually show follower history
Public tools (no login to the target account) are what most Indian creators use for themselves and competitors.
Comparison table (August 2026)
| Tool | Login needed for target? | History depth | Quality or fake-follower score | Best use | Typical cost | India payment friction |
| Instagram Insights | Your account only | About 90 days (Meta) | No | Official truth and content attribution | Free | None |
| Social Blade | No (public) | Years, if the handle was indexed | No | Long public slope, competitor shape | Free, with paid extras | Low |
| TrendHERO | No (public reports) | Multi-year growth charts on many public accounts | Yes (audience quality and fake split) | Shape of growth and one-off audit | Freemium | Medium |
| HypeAuditor | No for public reports | Growth history plus quality | Strongest of this list | Brand-safe audience check | Paid reports and plans | High (USD, enterprise) |
| Later | Yes (your connected account) | From connect; plan-capped analytics window | Weak versus auditors | Schedule and light analytics | Paid from about $19 to $25 per month (plans change) | USD card |
| Buffer | Yes | Thin versus Insights-first tools; 30-day analytics on lower plans | No | Cheap scheduling and basic reports | Free tier; paid from about $5 to $6 per channel | USD |
| Iconosquare | Yes | Deep own-account history and competitors | Limited versus HypeAuditor | Client reports, exports | Paid from about €33 per month on Launch (annual) | EUR or USD, rarely UPI |
| Social Status / NapoleonCat | Yes | From connect plus short backfill | Limited | Agency reporting | Paid (Social Status from about $7 per month listed historically) | USD |
Treat listed prices as directional. Vendors change plans. Recheck the live pricing page before you buy.
Social Blade
Longest freely available public graphs. Useful question: “Did this creator grow steadily or jump 8k in three empty days?” Weak on small or new handles that were never indexed. Daily points can lag 24 to 72 hours versus Insights. No authenticity score.
TrendHERO
Cleaner hover-for-daily-count graphs on many public accounts. Also scores audience quality. Good when you want shape, not only today’s number.
HypeAuditor
Use when brands will ask about fake or inactive followers and city mix. Periodic audit, not a daily habit. Relevant because Indian influencer audits keep flagging inflated followings (see HypeAuditor India analysis above).
Connected dashboards (Iconosquare, Later, Buffer, Social Status)
They store history from the day you connect, sometimes with a short backfill. Better for exports and client PDFs. Most Indian creators under 30k should not pay until a brand or agency needs that file.
Password unfollow apps
Skip them. Instagram’s official download and local comparison is the safer way to see list changes. Password or “login with Instagram” unfollower apps are the highest-risk option in this category.
Follower growth versus the numbers that predict income
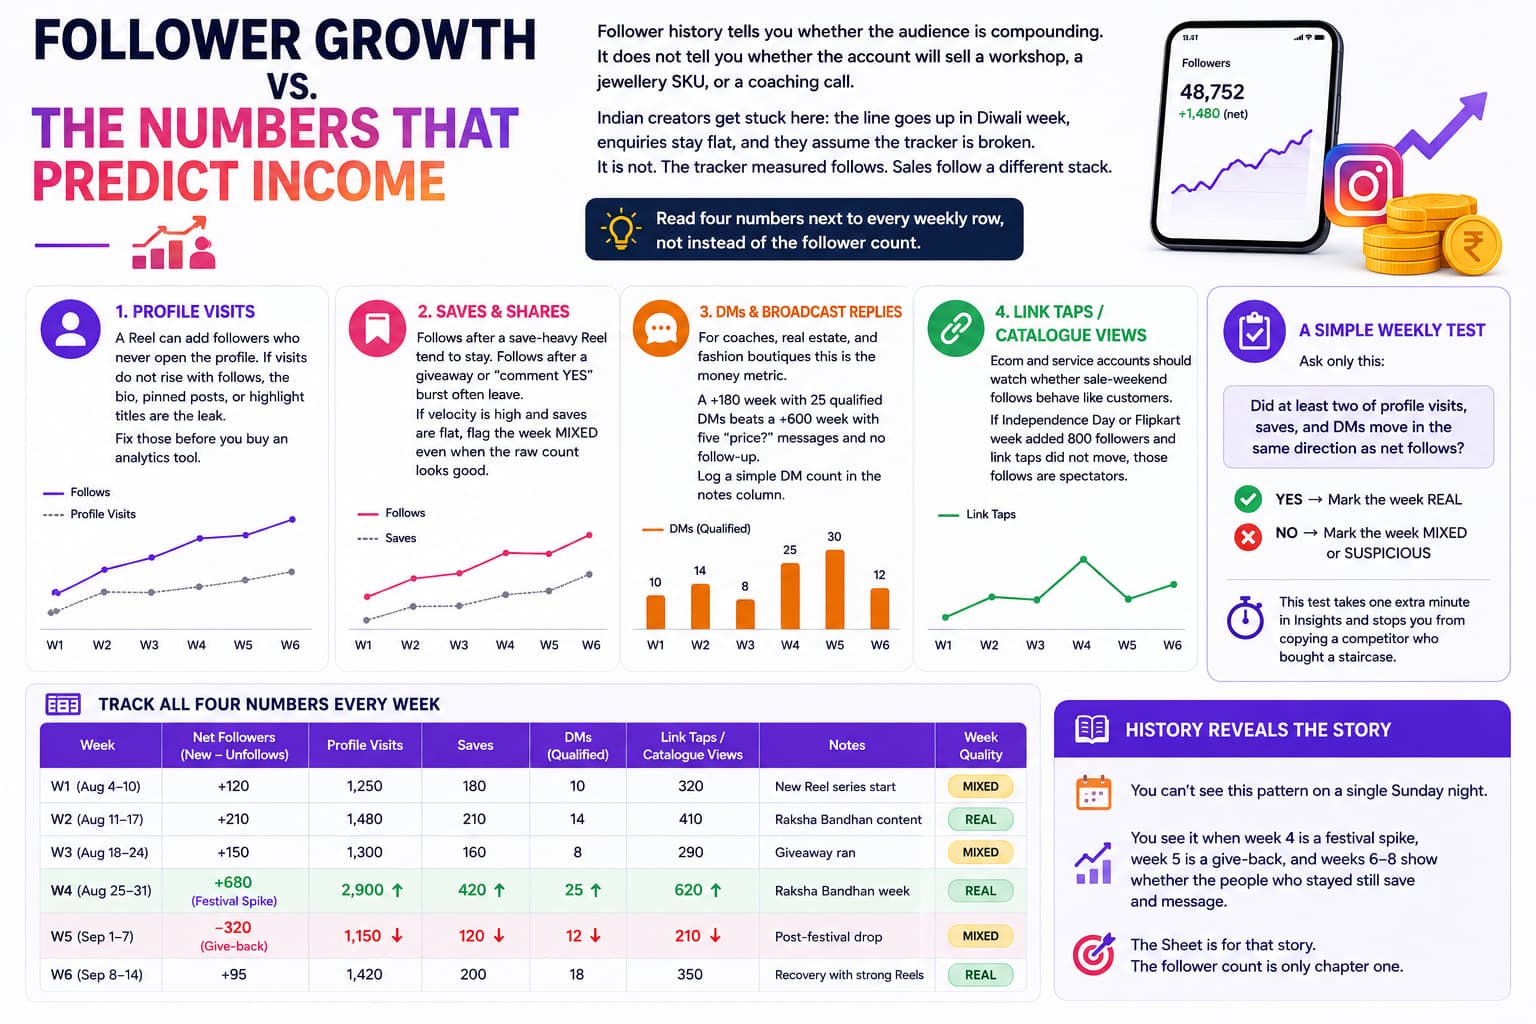
Follower history tells you whether the audience is compounding. It does not tell you whether the account will sell a workshop, a jewellery SKU, or a coaching call. Indian creators get stuck here: the line goes up in Diwali week, enquiries stay flat, and they assume the tracker is broken. It is not. The tracker measured follows. Sales follow a different stack.
Read four numbers next to every weekly row, not instead of the follower count.
Profile visits. A Reel can add followers who never open the profile. If visits do not rise with follows, the bio, pinned posts, or highlight titles are the leak. Fix those before you buy an analytics tool.
Saves and shares. Follows after a save-heavy Reel tend to stay. Follows after a giveaway or “comment YES” burst often leave. If velocity is high and saves are flat, flag the week mixed even when the raw count looks good.
DMs and broadcast replies. For coaches, real estate, and fashion boutiques this is the money metric. A +180 week with 25 qualified DMs beats a +600 week with five “price?” messages and no follow-up. Log a simple DM count in the notes column. You do not need a CRM on day one.
Link taps or catalogue views. Ecom and service accounts should watch whether sale-weekend follows behave like customers. If Independence Day or Flipkart week added 800 followers and link taps did not move, those follows are spectators. Check the same row 30 days later. If the extra followers are gone and taps never appeared, do not use that week in a rate card.
A simple weekly test
Ask only this: did at least two of profile visits, saves, and DMs move in the same direction as net follows? If yes, mark the week real. If only the follower line moved, mark it mixed or suspicious. That test takes one extra minute in Insights and stops you from copying a competitor who bought a staircase.
History still matters. You cannot see this pattern on a single Sunday night. You see it when week 4 is a festival spike, week 5 is a give-back, and weeks 6 to 8 show whether the people who stayed still save and message. The Sheet is for that story. The follower count is only chapter one.
How this guide scored the tools (editorial, Aug 2026)
Scores are 1 to 10 against six criteria that matter for Indian creators. This is an editorial scorecard, not a lab study.
| Criterion | Why it matters | Insights | Social Blade | TrendHERO | HypeAuditor | Iconosquare-class |
| History depth | Years versus 90 days | 4 | 9 | 8 | 7 | 7 after connect |
| Accuracy versus Insights | 30-day net should not wildly diverge | 10 | 6 | 7 | 7 | 8 |
| India and quality signals | Cities, language, fake score | 6 | 2 | 7 | 9 | 5 |
| Cost and INR / UPI friction | Monthly USD tools get dropped | 10 | 9 | 7 | 3 | 4 |
| Privacy and no password | Official API or public data only | 10 | 9 | 8 | 8 | 8 |
| Actionability | Notes, CSV, content tied to follows | 7 | 4 | 6 | 6 | 8 |
| Total out of 60 | 47 | 39 | 43 | 40 | 40 |
No tool hits 10 out of 10 on all six. That is why the combination wins: Insights for truth, Social Blade or TrendHERO for long public history, Sheet for context, HypeAuditor only when a brand asks about quality.
When Insights and Social Blade do not match
They will not match every day.
- Insights is the source of truth for your last 90 days.
- Social Blade and TrendHERO are public snapshot series. They can lag, miss small accounts, or show a jump Insights has not posted yet.
Rule:
- Content decisions this month: trust Insights.
- “How did this handle grow across 2024 to 2026?”: use Social Blade or TrendHERO.
- Social Blade shows +3,000 versus Insights +120: do not announce a breakout. Wait for the next Insights 7-day window.
- Both climb, engagement falls: treat new followers as low quality until comments and saves recover.
Brand briefing format that survives an audit: Insights screenshots for 30 to 90 days, plus one public history graph for the long slope. A single tracker number with no event notes is how inflated Indian media kits get rejected.
What Indian creators repeat on Reddit
Threads in r/InstagramMarketing and r/IndianEntrepreneur keep landing on the same points:
- Forgot to screenshot Insights; now last year’s Diwali is gone
- Social Blade is the default free history check, weak under about 10k to 20k
- Password unfollower apps cause account issues
- One day a week, log the number plus the Reel that performed
- Agencies add Iconosquare-class tools only when clients need PDFs
- Festival and cricket weeks look huge, then flatten; January looks “dead” if you never labelled October
Consensus matches the three-layer system. Label festival spikes. Do not treat them as the new baseline.
How to read spikes and drops
| Pattern | Usual cause | What to check |
| Sharp 3 to 7 day spike, then partial give-back | Viral Reel, collab, festival | Insights attribution and whether reach and saves rose |
| Slow, almost linear climb | Bought follows or follow-for-follow | Quality tool and your engagement rate |
| Sudden drop, no content change | Platform cleanup of fake or inactive accounts | 30-day window; growth often resumes if content still works |
| Plateau after 10k or 50k | Reach to non-followers falls as a share | Bio, pinned posts, highlights, Reel hook. Not “post more” |
Regional-language Reels that stay inside Tamil, Malayalam, or Hindi communities often retain better than English “growth hack” posts that attract random follows outside the niche.
Weeks that move Indian creator graphs
If you do not label the week, you will think the content broke.
| Window | What usually happens | Tracking note |
| IPL, World Cup, big India matches | Reels travel outside your city; casual fans arrive | Expect give-back after the final |
| Ganesh Chaturthi, Onam, Pongal, Navratri, Diwali, New Year | Regional-language festive posts retain better than generic English festive posts | Compare retention 30 days later, not peak day |
| Exam and wedding seasons | Education and jewellery or clothing get slower local follows | City mix in Insights matters |
| Amazon/Flipkart, Republic Day, Independence Day sales | Ecom follows behave like customers | Did they stay 30 days? |
| Quiet mid-month and platform cleanup | Drop of a few hundred with no content change | Common after a suspiciously linear climb |
Write the event the same day. Three months later you stop asking why October beat February.
How to track competitors (you cannot see their Insights)
- Social Blade or TrendHERO username search for multi-year shape
- HypeAuditor or TrendHERO quality report before a collab
- Weekly note: “Competitor X gained 4k in IPL week, we gained 1.1k. Their format was a 15-second recipe with voiceover.”
Track 3 to 5 accounts in the same niche, language, and city tier. Not 1 million follower celebrity graphs.
What Indian brands and agencies actually look at
They are rarely impressed by today’s count. They look for:
- A slope, not a staircase of 5k blocks
- Growth that lines up with public posts
- Audience cities that match the product (Jaipur jewellery versus pan-India English fitness)
- Whether the last festival spike stayed
- Engagement that did not collapse after the follower line rose
A sheet with velocity and event notes answers that in five minutes.
Weekly workflow (15 to 20 minutes)
Sunday or Monday:
- Insights: 7-day and 30-day net, plus top attributed Reel
- Update the Sheet (count, change, velocity, content, event, quality flag)
- Glance at Social Blade for you and two competitors
Monthly: quality check plus city and language mix Quarterly: 90-day Insights screenshot plus CSV export
That is enough to see compounding versus oscillation.
Mistakes that waste time
- Checking the number every day and changing strategy after one Tuesday
- Putting only the current count in a media kit
- Paying for a suite before you have 90 days of your own labelled data
- Ignoring unfollows
- Assuming a US 200k fashion dashboard is accurate for a 12k Coimbatore food account
- Treating a Diwali spike as the new normal
- Further reading: Socialinsider's guide to follower history methods covers the same manual-log approach with a global (non-India) lens.
Sources and notes
- Meta / Instagram Help: account Insights date ranges are limited to the past 90 days; follower trend views generally require 100 or more followers.
- Tool prices and plan names change; figures above are public list prices observed in 2026 vendor and comparison pages (Later, Buffer, Iconosquare). Confirm before purchase.
- Velocity percentages in this article are practical benchmarks for reading your own Sheet, not Instagram-published KPIs.
- https://www.facebook.com/business/help/788388387972460 https://blog.hypeauditor.com/state-of-instagram-influencer-marketing-in-india/ https://www.shopify.com/blog/instagram-insights https://www.socialinsider.io/blog/instagram-follower-history/
About The Author:
Aravindh Kumar is an ecommerce and Instagram growth expert with 8+ years of experience in online selling. He has worked with 500+ brands - including Forbes-listed companies - He has helped 200+ Instagram businesses grow their online presence.