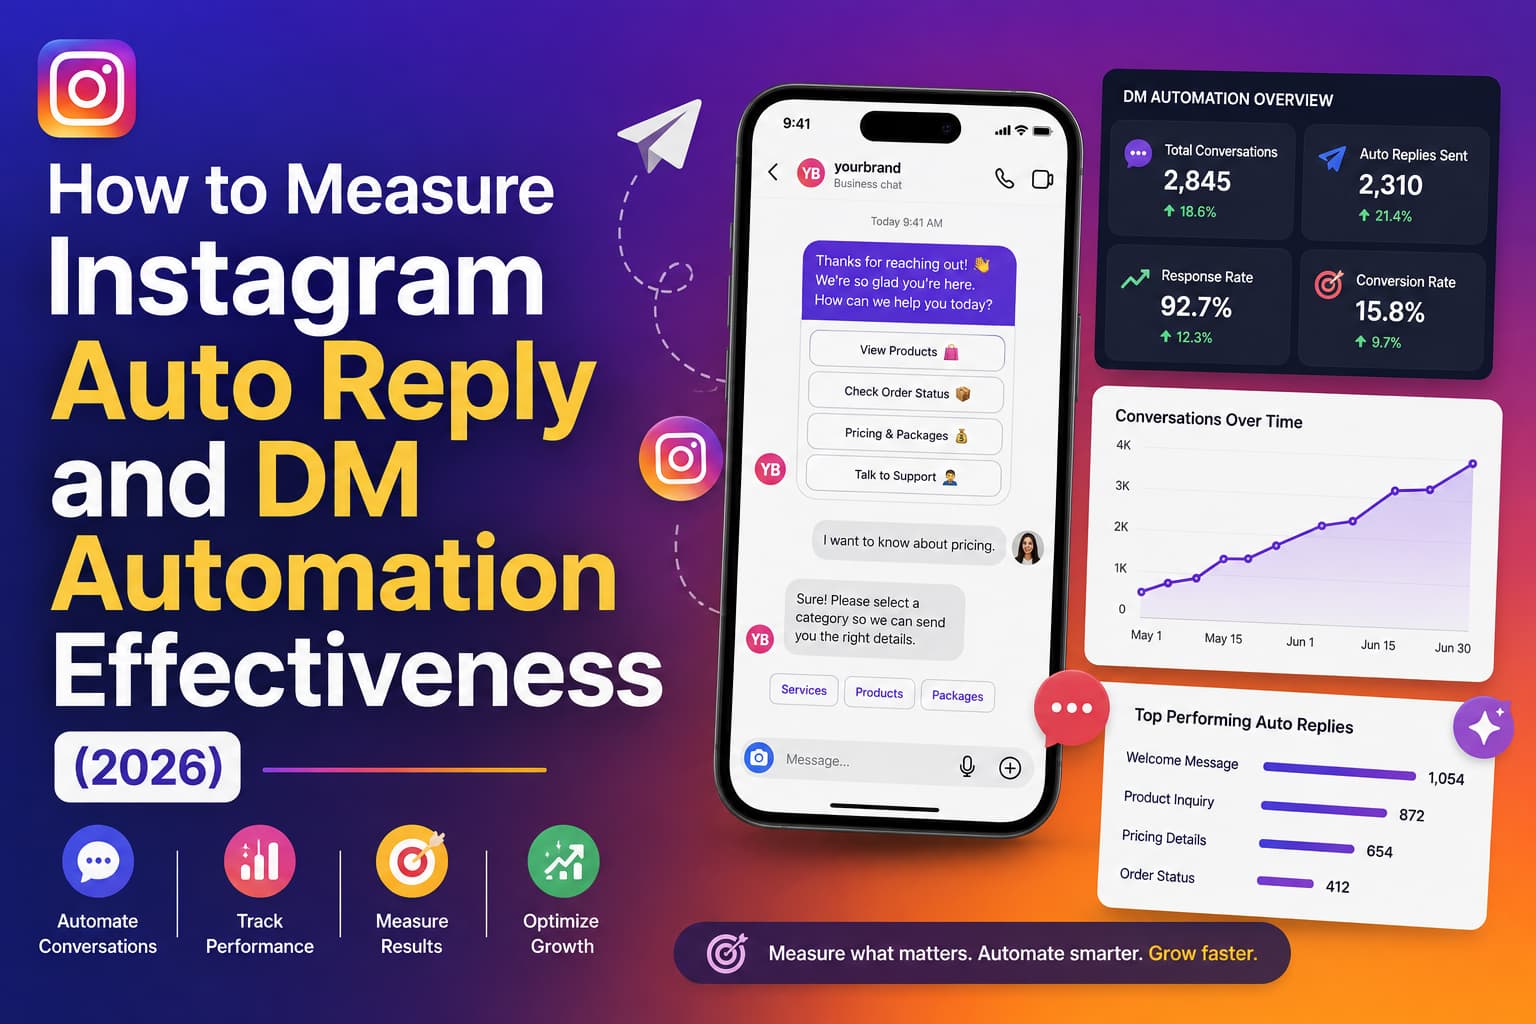
Most people set up comment-to-DM or story-reply automations, watch “messages sent” climb, and assume it is working. That number is almost useless on its own. You can send thousands of DMs and still lose sales, annoy people, or slowly damage the account.
Effectiveness only shows up when you connect speed, replies, clicks, and actual money back to the specific trigger that started the conversation.
This guide covers the metrics that actually predict revenue, realistic 2026 benchmarks, how to track results in GA4, how to attribute sales, what Reddit users keep saying, and how the main tools compare when you judge them by their analytics — not their marketing pages.
Why Should You Measure Instagram Auto Reply and DM Automation at All?
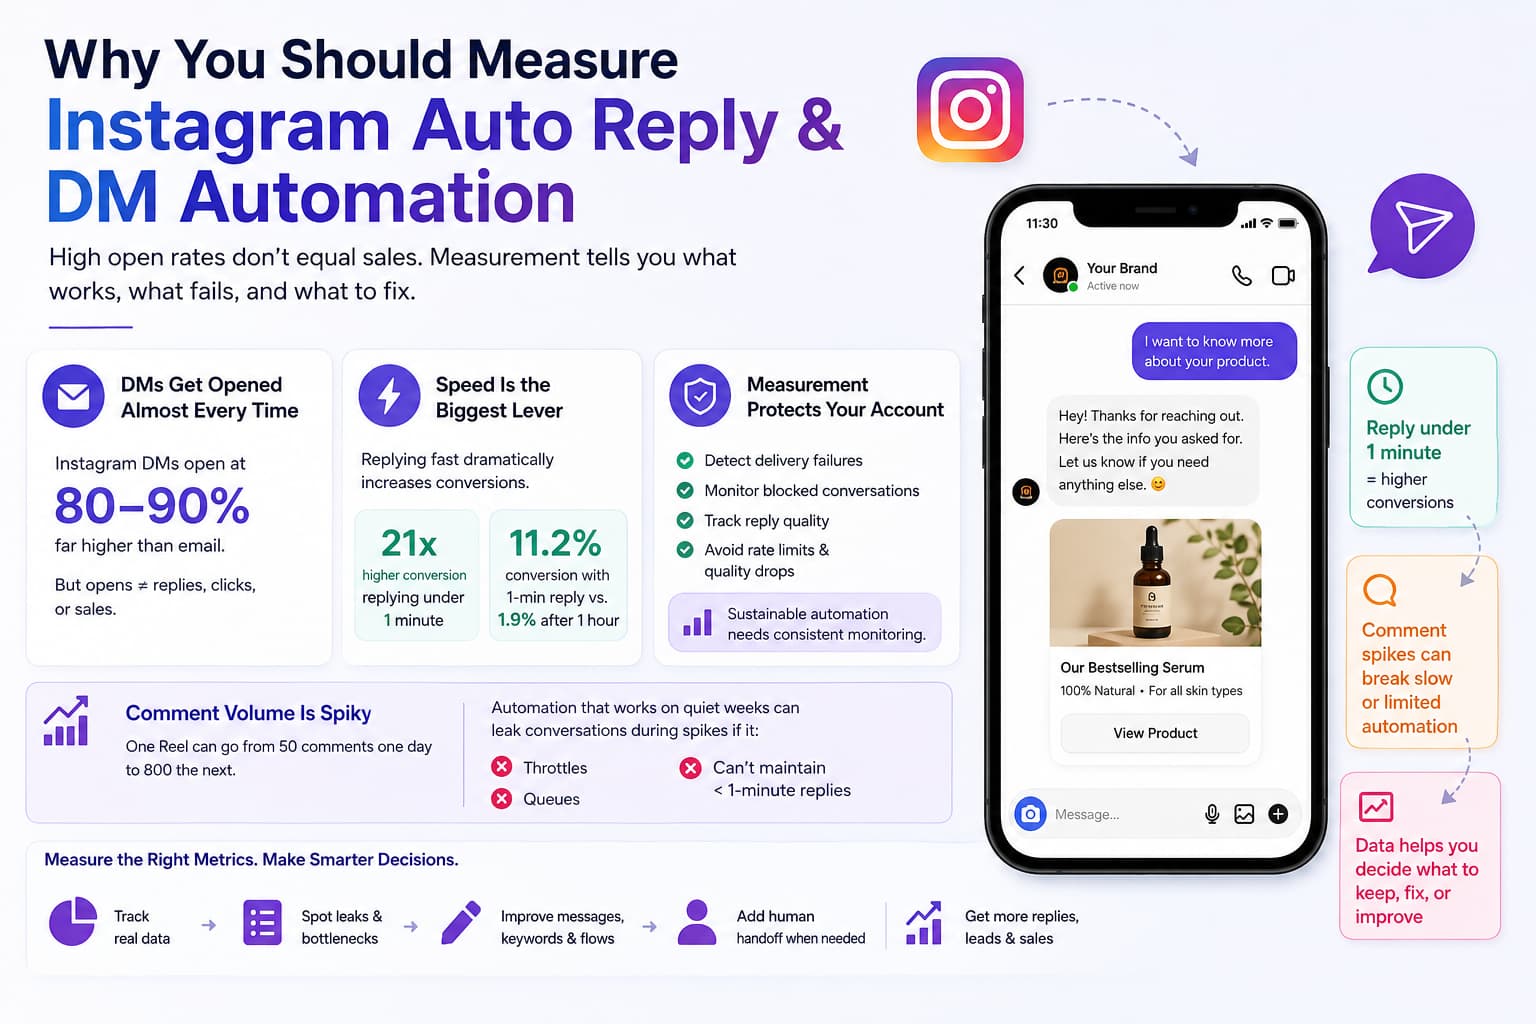
Instagram DMs still open at 80–90% when they land in the inbox. That is far higher than email. High open rates do not automatically mean sales. People open almost everything that pings their phone. They only reply, click, or buy when the message feels relevant and arrives fast.
Speed is the biggest lever. Multiple 2026 datasets show replies under one minute convert many times higher than replies after 30 minutes. This isn't a new phenomenon specific to Instagram — a widely cited Harvard Business Review study tracking over a million sales leads found that responding within five minutes made a company 21x more likely to qualify a lead than responding after 30 minutes. Instagram-specific data shows the same pattern:
One analysis put the lift at 21x. Another found 1-minute replies converting at 11.2% versus 1.9% after an hour. If your automation is delayed, queued, or failing silently on viral posts, you are measuring the wrong thing.
Measurement also protects the account. Unofficial tools or aggressive sending can trigger rate limits or quality drops that Instagram does not announce loudly. Tracking delivery failures, blocked conversations, and reply quality tells you whether the system is sustainable.
There is a second reason that matters more now than it did two years ago. Comment volume is spikier. One Reel can produce 50 comments one day and 800 the next. An automation that looks fine on a quiet week can leak half the conversations during a spike if the tool throttles or cannot keep first-response time under a minute. If you only look at monthly totals, you never see the leak.
Without numbers, you cannot decide whether to keep a flow, rewrite the first message, change the keyword, or add a human handoff. You just keep sending.
What Does Effectiveness Actually Mean for Auto Replies Versus Full DM Funnels?
An auto reply and a full DM automation are not the same job, so they should not share one success number.
Type | Main job | Judge it by |
Auto reply / first touch | Fast, relevant first message after a comment, story reply, or keyword | Speed, open rate, reply rate, whether the conversation continues |
Full DM funnel | Qualifier, link, booking, follow-up, human handoff | CTR, click-to-sale, revenue per conversation, handoff quality |
Support automation | Answer FAQs and reduce inbox load | Resolution rate, tickets avoided, time saved |
A welcome DM that gets a 70% reply rate can still be working even if nobody buys yet. A sales flow with a 12% reply rate and a 15% click-to-sale rate can be working even if it feels quieter. Separate the goal before you judge the numbers.
A useful rule: first-touch auto replies are judged on conversation quality. Sales sequences are judged on money. Support automations are judged on resolution time and tickets avoided.
What Are the Core Metrics That Show If Auto Replies Are Working?
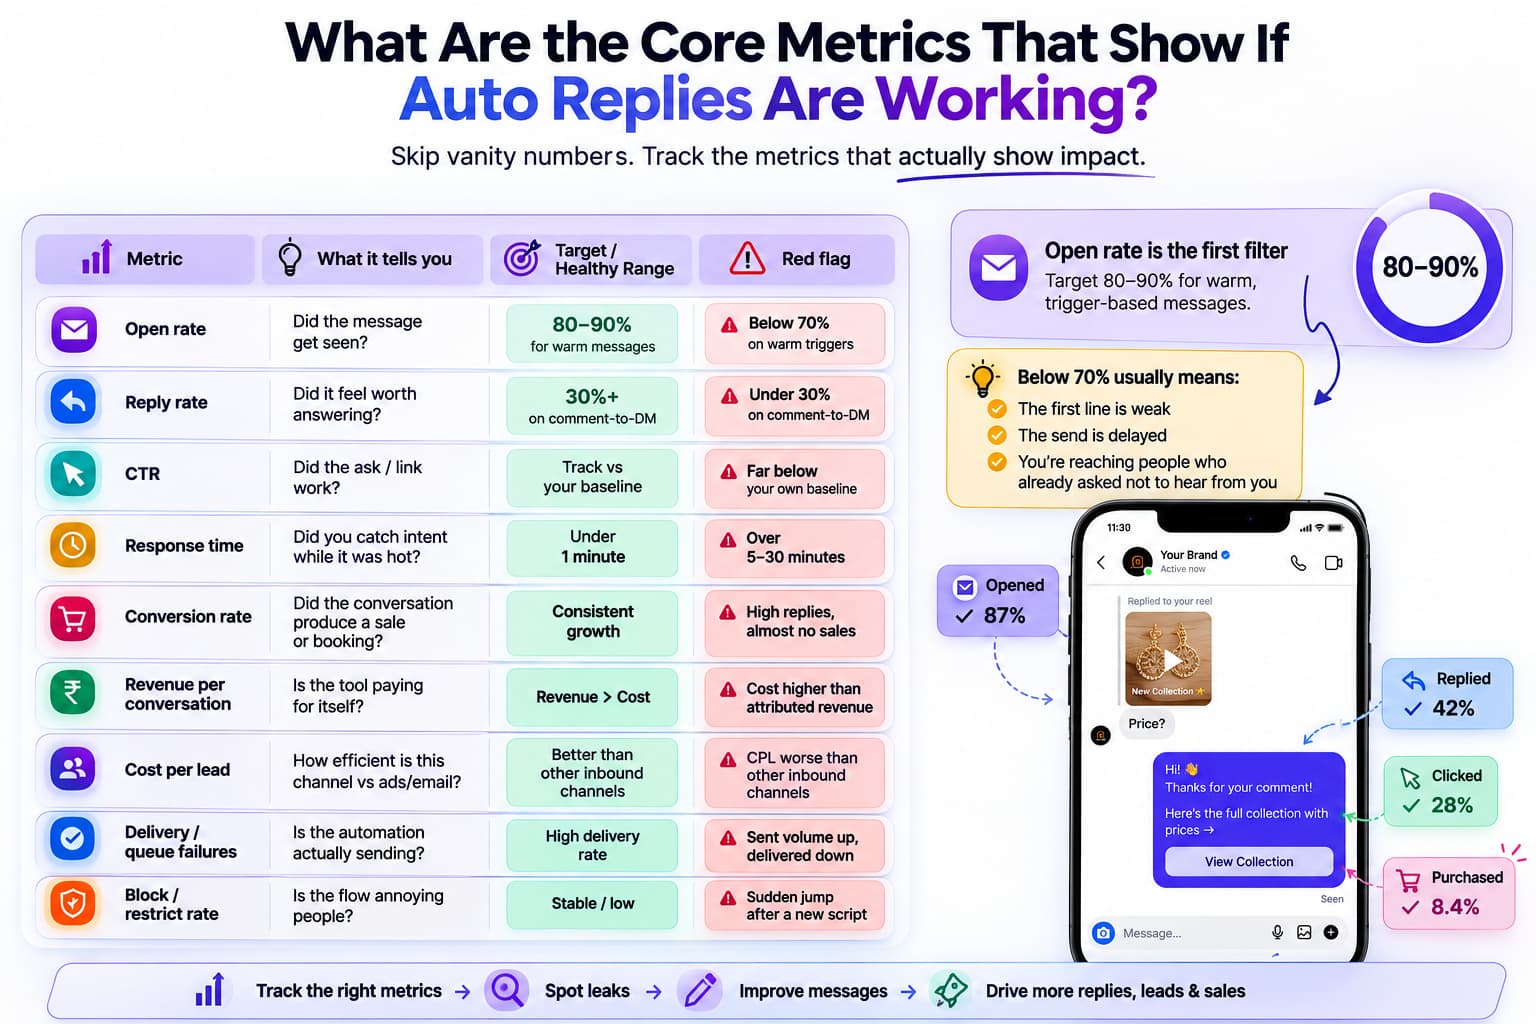
Ignore total DMs sent, follower count, and profile visits as primary KPIs. Those move independently of revenue.
Metric | What it tells you | Red flag |
Open rate | Did the message get seen? | Below 70% on warm triggers |
Reply rate | Did it feel worth answering? | Under 30% on comment-to-DM |
CTR | Did the ask / link work? | Far below your own baseline |
Response time | Did you catch intent while it was hot? | Over 5–30 minutes |
Conversion rate | Did the conversation produce a sale or booking? | High replies, almost no sales |
Revenue per conversation | Is the tool paying for itself? | Cost higher than attributed revenue |
Cost per lead | How efficient is this channel vs ads/email? | CPL worse than other inbound channels |
Delivery / queue failures | Is the automation actually sending? | Sent volume up, delivered down |
Block / restrict rate | Is the flow annoying people? | Sudden jump after a new script |
Open rate is the first filter. Target 80–90% for warm, trigger-based messages. Below 70% usually means the first line is weak, the send is delayed, or you are hitting people who already asked not to hear from you.
Reply rate is the engagement signal. Comment-to-DM on a relevant post often lands 50–60%. Story replies sit a bit lower. Cold or broadcast-style DMs drop to 12–25%. Under 30% on a warm trigger usually means the opener is too salesy or too long.
Click-through rate is the money metric for most product and affiliate flows. Average 12–18%, with strong campaigns hitting 25%+. Bio-link CTR is typically 2–3%, so a well-timed DM should beat it easily.
Response time is how quickly the first DM goes out after the trigger. Keep it under 60 seconds. Test it yourself from a second account every week. Tools that claim “instant” but queue during spikes are not instant.
Conversion and revenue depend on the offer. Micro accounts and high-intent niches often see 10–20% from engaged DM conversations. Larger or colder audiences sit lower. Track both click-to-purchase and full conversation-to-purchase.
Account-health metrics are the ones most people skip: delivery failure rate, messages queued versus sent during a viral hour, people who restrict or report after a flow, and whether Professional account permissions stay intact. If sent volume is up but delivered is down, the automation is not working. It is failing quietly.
How Do I Measure Reply Quality, Not Just Reply Count?
A 55% reply rate can still be weak if most answers are “ok”, “spam?”, or a single emoji. Sort a sample of 20–30 replies every week into three buckets.
Reply type | Example | What it means |
High intent | “What’s the price?”, “Can I get this in 2 days?”, “Is this for beginners?” | Flow is attracting buyers |
Neutral | “Thanks”, “Okay”, “Sent” | First message worked, next step is weak |
Low intent / friction | “Stop”, “Who is this?”, “Is this a bot?” | Opener is too salesy or too generic |
Track the share of high-intent replies, not only total replies. If high-intent replies rise after you shorten the first message, the automation is getting more effective even if total reply rate stays flat.
This is also how you decide when to hand off. High-intent questions should reach a human quickly. Neutral replies can stay in a short follow-up sequence.
How Do I Calculate These Metrics in Practice?
Most tools give you sent, delivered, opened, and replied. Instagram Insights does not give you DM link clicks, so you need either the tool’s click tracking or UTM + Google Analytics 4.
Metric | Formula |
Open rate | (Opened ÷ Delivered) × 100 |
Reply rate | (Conversations with at least 1 user reply ÷ Delivered) × 100 |
CTR | (Link/button clicks ÷ Delivered) × 100 |
Click-to-sale | (Purchases or bookings ÷ Clicks) × 100 |
Conversation-to-sale | (Purchases or bookings ÷ Conversations started) × 100 |
Revenue per conversation | Attributed revenue ÷ Conversations started |
Cost per lead | (Tool cost + ad spend + time value) ÷ Leads captured |
ROI | (Revenue + time-saved value − cost) ÷ Cost × 100 |
For time value, pick a realistic hourly rate. 200 DMs at 2–3 minutes each is 7–10 hours a month. That number belongs in the ROI calculation even if you never hire anyone.
Worked example
You send 400 comment-to-DM messages in a month.
Step | Number |
Delivered | 360 |
Opened | 310 (86%) |
Replies | 190 (53%) |
Clicks | 70 (19%) |
Purchases | 12 |
Product price | ₹1,999 |
Revenue | ~₹23,988 |
Tool cost | ₹1,200 |
Time previously spent | 8 hours |
Even before you assign an hourly rate, the flow is paying for the tool. If the same 400 messages produced 25 replies and 4 clicks, the automation would still be “sending,” but it would not be effective.
How Do I Find Where the Funnel Is Leaking?
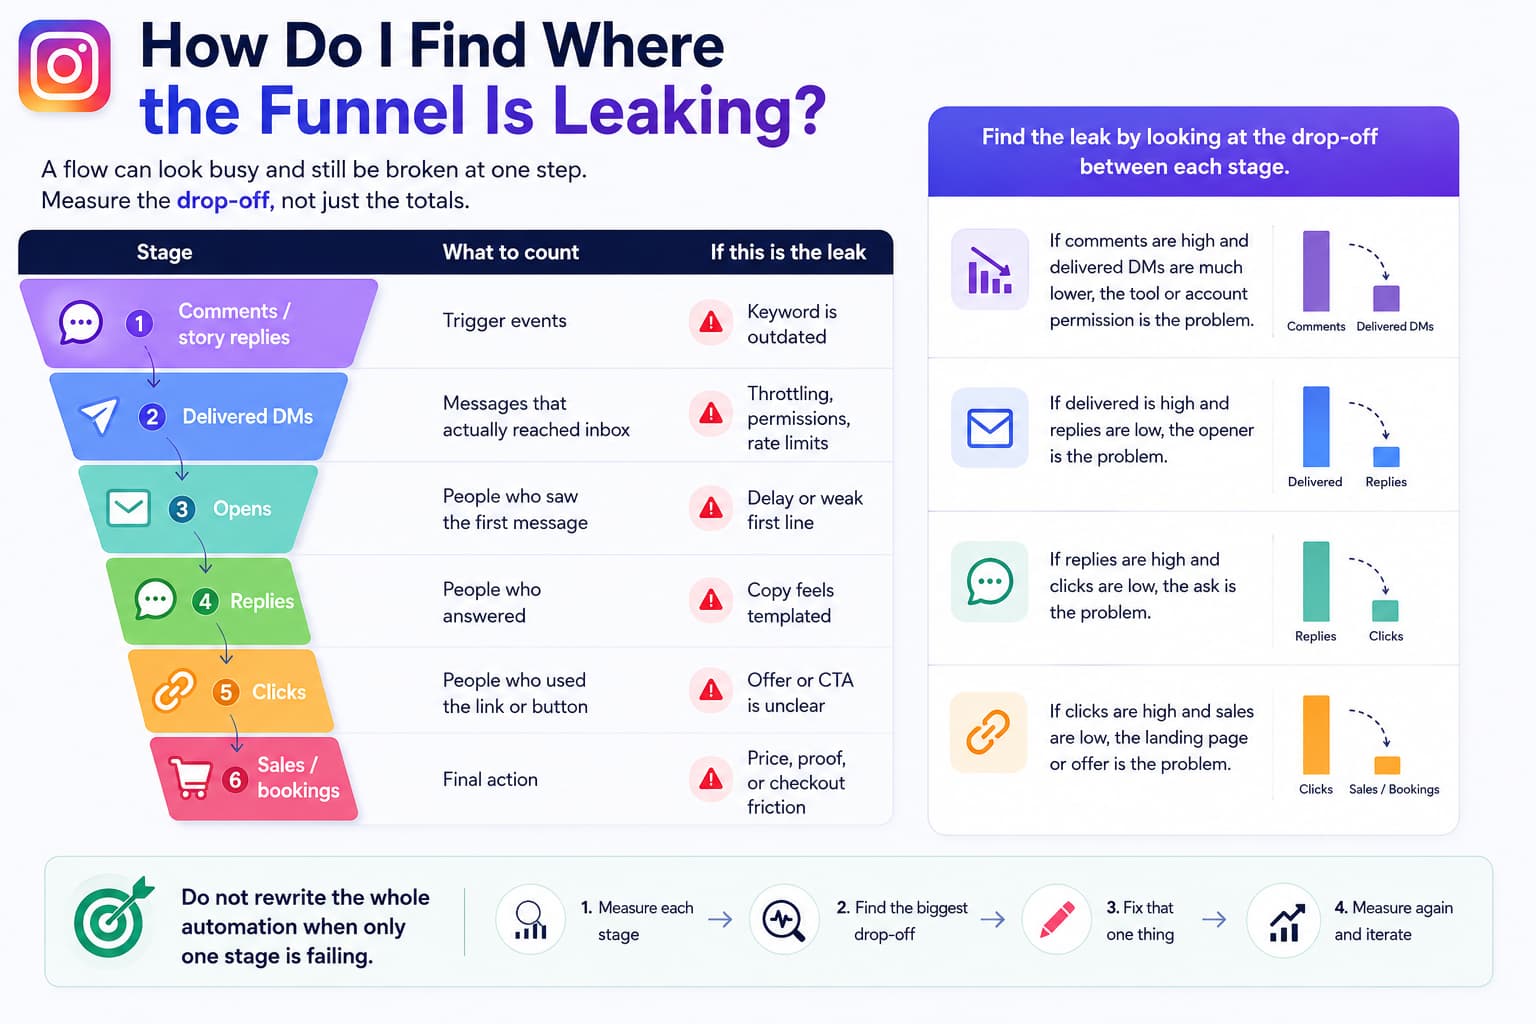
A flow can look busy and still be broken at one step. Measure the drop-off, not just the totals.
Stage | What to count | If this is the leak |
Comments / story replies | Trigger events | Keyword is outdated |
Delivered DMs | Messages that actually reached inbox | Throttling, permissions, rate limits |
Opens | People who saw the first message | Delay or weak first line |
Replies | People who answered | Copy feels templated |
Clicks | People who used the link or button | Offer or CTA is unclear |
Sales / bookings | Final action | Price, proof, or checkout friction |
If comments are high and delivered DMs are much lower, the tool or account permission is the problem. If delivered is high and replies are low, the opener is the problem. If replies are high and clicks are low, the ask is the problem. If clicks are high and sales are low, the landing page or offer is the problem.
Do not rewrite the whole automation when only one stage is failing.
What Are Realistic Instagram DM Automation Benchmarks in 2026?
Use these ranges as a sanity check, not a strict target. Your own baseline matters more. If you are far outside these numbers, something is usually broken in the trigger, copy, or delivery. For a broader, independently benchmarked view of social engagement rates beyond DMs specifically, the Sprout Social Index is a useful cross-reference.
Core metrics by automation type
Automation Type | Open Rate | Reply Rate | CTR | Notes |
Comment-to-DM (high intent) | 85–92% | 50–65% | 15–28% | Best overall performance |
Story reply automation | 82–90% | 40–55% | 12–22% | High intent, slightly lower volume |
Keyword trigger in DM | 80–88% | 30–45% | 10–20% | Depends heavily on keyword quality |
Broadcast / cold DM | 70–82% | 12–25% | 5–12% | Weakest; use sparingly |
CTR by follower range (warm triggers)
Follower Count | Average CTR | Strong CTR |
1K–10K | 18–25% | 25–32% |
10K–100K | 15–22% | 22–28% |
100K–500K | 12–18% | 18–24% |
500K+ | 8–15% | 15–20% |
DM-to-sale conversion by niche
Niche | Typical Conversion | Strong Performance |
E-commerce / Shopify | 7–12% | 15%+ |
Coaches / Educators | 5–10% | 12–18% |
Digital products | 8–15% | 18%+ |
Real estate / Local services | 4–9% | 12%+ |
Affiliates | 6–12% | 15%+ |
Response time vs conversion
First response time | What usually happens |
Under 1 minute | Highest conversion window |
1–5 minutes | Still strong |
30–60 minutes | Sharp drop |
24+ hours | Most impulse buyers are gone |
DMs vs email
Metric | Instagram DM | |
Open rate | 80–90% | 21–43% |
Click rate | 12–28% | 2–3% |
Reply rate | 30–60% on warm triggers | 1–5% |
Best use | Capture at peak intent | Nurture over time |
Track your own numbers for 2–3 weeks before judging a flow. A 42% reply rate on a new comment-to-DM can still be excellent if the previous version sat at 28%.
How Should Benchmarks Change by Niche and Account Size?
A 12% CTR can be excellent for one account and weak for another. Compare against your own history first.
Situation | What “good” usually looks like |
High-intent comments like “price”, “link”, “details” | Higher reply and CTR than generic “yes” |
Story replies | Strong conversion because the person already took an extra step |
Broadcasts to people who did not just interact | Lower on every metric; that is audience temperature, not always a tool failure |
Micro accounts | Higher reply and conversion because the relationship feels closer |
Large accounts | Lower percentages, higher volume |
E-com / affiliates | Judge CTR and revenue per DM |
Coaches | Judge reply rate, qualification rate, booked calls |
Real estate / local services | Judge response time and lead quality |
If your niche is price-sensitive, measure more than first purchase. A cheaper product with repeat buyers can justify a lower first-conversion rate. Local payment mentions, INR pricing, and short proof in the first or second message often change the reply mix more than a new tool does.
How Do I Set Up Proper Revenue Tracking for Instagram DMs?
Instagram does not show you DM link clicks inside native Insights. You need external tracking.
Step 1: Add UTM parameters to every link
text
Examples:
- utm_campaign=reel-pricing-aug&utm_content=comment-to-dm
- utm_campaign=story-leadmagnet&utm_content=story-reply
Rules that prevent messy data:
- Always lowercase
- Use hyphens
- Keep campaign names short and consistent
- Do not change naming style mid-month
Generate the full URL with Google’s Campaign URL Builder, then shorten it if needed.
Step 2: Place the link correctly inside the DM
Put a blank line before the link. That helps Android display. Prefer a button or clear CTA when the tool supports it. Test the final message on both iOS and Android before you scale the flow.
Step 3: Configure Google Analytics 4
- Go to Explore and create a new exploration. (See Google’s exploration guide if you haven’t built one before)
- Filter session source = instagram and session medium = dm.
- Add Campaign and Content as secondary dimensions.
- Mark purchases, form submits, or bookings as conversions.
- Review sessions, conversions, and revenue.
Step 4: Add a second source of truth
Use unique discount codes inside specific flows (IGDM20, STORY15) or a calendar / form question: “Came from Instagram DM?”
Step 5: Do a 5-minute weekly matching check
Compare | Why it matters |
Tool-reported clicks vs GA4 sessions | Shows tracking leakage |
Code redemptions vs reported conversions | Catches last-click gaps |
Comments vs DMs actually delivered | Catches silent throttling |
This dual system is more reliable than depending on any single tool’s built-in analytics.
How Can I Attribute Real Revenue Instead of Guessing?
Method | How it works | Best for |
UTM + GA4 | Tag every outbound link, filter in GA4 | Ecommerce and landing pages |
Unique coupon codes | One code per flow | Shopify / checkout brands |
CRM / conversation tags | Tag trigger at first contact, pass it through | Coaches, agencies, services |
Combined | Use all three | Highest accuracy |
Do not rely on last-click only. Someone may click the DM link, leave, then buy two days later from a retargeting ad. The DM still started the conversation. Record the source at the moment of first contact.
If you sell outside a clean checkout, ask one qualifying question in the flow or have your closer tag the lead source. Imperfect tagging beats no tagging.
How Does the 24-Hour Messaging Window Affect Measurement?
Instagram's 24-hour customer care window — documented in Meta's official Instagram Platform messaging policies — changes what you can send and what you should track. If someone replies, you can usually continue the conversation more freely for the next day. If they only open and never answer, your follow-up options shrink.
That means sequence analytics matter as much as first-message analytics.
Message | What to track |
Message 1 | Open rate, reply rate, response time |
Message 2 (follow-up) | Additional replies and clicks from people who went quiet |
After 24 hours | How many conversations died because you had no allowed follow-up |
A flow that looks average on day one can still win if message 2 recovers 15–25% of silent openers. If you never measure follow-up separately, you will think the first DM failed when the real issue was no second touch.
How Do the Main Instagram DM Automation Tools Compare on Analytics?
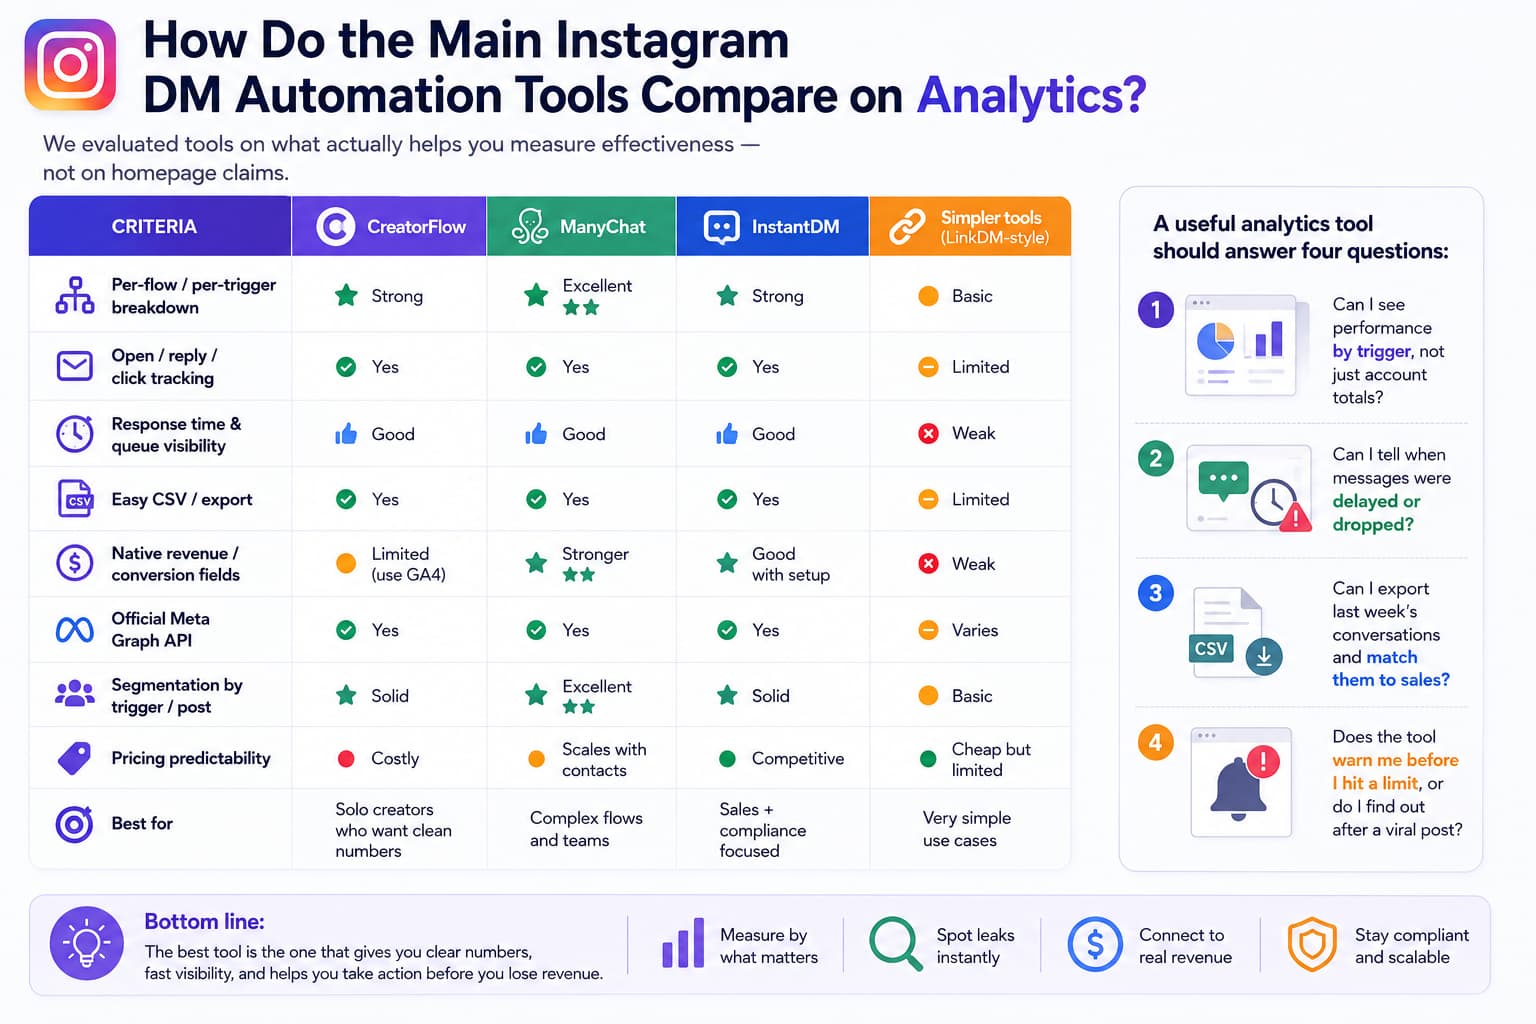
We evaluated tools on what actually helps you measure effectiveness — not on homepage claims.
Criteria | ManyChat | InstantDM | Simpler tools (LinkDM-style) |
Per-flow / per-trigger breakdown | Excellent | Strong | Basic |
Open / reply / click tracking | Yes | Yes | Limited |
Response time & queue visibility | Good | Good | Weak |
Easy CSV / export | Yes | Yes | Limited |
Native revenue / conversion fields | Stronger | Good with setup | Weak |
Official Meta Graph API | Yes | Yes | Varies |
Segmentation by trigger / post | Excellent | Solid | Basic |
Pricing predictability | Scales with contacts | Competitive | Cheap but limited |
Best for | Complex flows and teams | Sales + compliance focused | Very simple use cases |
A useful analytics tool should answer four questions:
- Can I see performance by trigger, not just account totals?
- Can I tell when messages were delayed or dropped?
- Can I export last week’s conversations and match them to sales?
- Does the tool warn me before I hit a limit, or do I find out after a viral post?
No tool gives perfect revenue attribution by itself. The winners are the ones that show per-automation performance, make export or GA4 connection easy, surface delivery problems, and stay on official APIs.
If a tool only shows “messages sent,” it is not helping you measure effectiveness. It is only helping you feel busy.
What Do People on Reddit Actually Say?
A recurring thread in r/SocialMediaMarketing is that generic “set it and forget it” auto-replies are getting ignored. Users report that fast first replies still help, but once the conversation stays templated, trust drops and replies stall. The hybrid approach — automation for the first touch, then a human or smarter follow-up once someone answers a real question — keeps coming up as what still works.
Another common complaint: volume hides the good leads. A Reel does well, hundreds of comment-to-DM messages go out, and the inbox becomes a mix of “price?”, collaboration requests, and low-intent replies. People miss the high-intent ones unless they have tagging or a way to sort by intent.
Creators also note that story-reply and keyword triggers outperform cold broadcasts, and that a short first message plus one question beats a long pitch with a link.
Reddit pattern | What it means for measurement |
Generic scripts get ignored | Reply rate is a copy quality metric, not just a volume metric |
Fast first touch still works | Response time belongs on the weekly dashboard |
Over-automation kills trust | Track blocks, one-word replies, and drop-off after message 1 |
High-intent leads get buried | Measure qualification / tagging, not only conversations started |
Hybrid performs best | Track handoff rate and close rate after human takeover |
If your numbers look bad, the Reddit consensus is usually this: the copy or the trigger is the problem, not the idea of automation.
How Do I Set Up a Simple Weekly Dashboard?
You do not need a 20-column spreadsheet. Review these numbers once a week.
Weekly number | What to look for |
Conversations started by trigger | Which post or story actually created chats |
Open rate | Sudden drop usually means delay or weak first line |
Reply rate | Copy / trigger problem |
High-intent reply share | Whether buyers are in the mix |
CTR | Ask or link problem |
Attributed revenue or leads | Whether the flow is paying |
Test-account response time | Hidden queueing |
Failed / queued messages on your biggest content day | Silent leak |
Blocks / restricts | Account-health warning |
Compare to last week and to your own baseline. If a new Reel’s comment-to-DM underperforms, the keyword or the first sentence is usually the issue. If everything is down, check account permissions, Professional account status, and whether Instagram flipped a setting.
Record the date you last changed a message. Without a before/after, you cannot tell if a rewrite helped.
Do the review on the same day every week. Sunday night or Monday morning works because you can still fix copy before the next content burst.
What Mistakes Make Measurement Useless?
Mistake | What happens | Fix |
Tracking only volume | 1,000 weak DMs look better than 200 strong ones | Lead with reply rate, CTR, revenue |
Inconsistent UTM names | GA4 data splits and becomes unusable | One naming system, lowercase, hyphens |
Not testing from a second account | Dashboard looks green while messages queue | Weekly live test |
Ignoring follow-ups | You miss conversions that happen on message 2 or 3 | Track sequence performance |
Relying on Instagram Insights for DM clicks | You never see the money metric | UTM + GA4 or tool click tracking |
Changing three things at once | You cannot tell what moved the number | One variable per week |
Counting every reply as a lead | “ok” and “what’s the price?” get mixed | Add a qualification rate |
Ignoring mobile display | Android users never see the link cleanly | Screenshot every DM on a phone |
How Do I Improve the Numbers Once I Am Tracking Them?
Start with the first message. Keep it under 12–15 words, reference the specific comment or story, and ask one question. Several practitioners report reply-rate lifts of around 10 points just from shortening and personalizing the opener.
Tighten keywords. People stop commenting “link” and start using “price”, “how”, “where”, or emojis. Review the actual comments on your last three posts and update triggers.
Add a follow-up 24–48 hours later for people who opened but did not reply. One extra message often doubles booked calls or purchases among already-engaged people.
If this is weak | Change this first |
Open rate | Timing, first line, send reliability |
Reply rate | Opener length, relevance, one question |
CTR | Ask, link placement, offer clarity |
Conversion | Price, proof, checkout friction, follow-up |
Volume but no quality | Keywords and qualification questions |
Delivery during spikes | Tool throttling, official API, send limits |
Test one variable at a time for a week.
Improve the handoff, not just the opener. When someone asks a detailed question, a clean “talk to us” path often saves the sale. Track how many conversations needed a human and how many of those closed.
What Does a Real Improvement Look Like?
An 8,000-follower coach was sending a 70-word comment-to-DM with the booking link in the first message. Weekly numbers: 220 delivered, 41% reply rate, 8% CTR, 3 bookings.
They changed only two things: the opener became 11 words plus one question, and the link moved to message 2 after the person answered. The next two weeks: 198 delivered, 54% reply rate, 16% CTR, 7 bookings.
Volume went down slightly. Revenue went up. That is what effective automation looks like. The old dashboard would have said “sending fewer DMs, maybe it got worse.” The right dashboard showed the opposite.
Use a before/after like this every time you change copy. If you cannot point to the date of the change, the new numbers are just noise.
About the author:
Aravindh Kumar is an ecommerce and Instagram growth expert with 8+ years of experience in online selling. He has worked with 500+ brands - including Forbes-listed companies - He has helped 200+ Instagram businesses grow their online presence.