

Ready to Automate Your Growth?
Join 30,000+ creators and brands using InstantDM today.
Get Started NowAny support required, we're just one click away.
Meta Business Partner
100% Official API
Paste in the numbers from any reel, post, or carousel and get a Virality Score out of 100, plus the exact signals holding it back. No login, no API, everything runs in your browser.
What makes a reel go viral? Three ranking signals: watch time (people finish or rewatch it), sends per reach (people share it with friends), and saves. Instagram head Adam Mosseri has publicly named watch time and sends per reach among the top signals, and this analyzer weights your reel the same way.
Grab these numbers from the post's insights (Professional dashboard → Content).
Enter your stats and the analysis appears here.
Save and share rates are measured against views.
Shares and saves are weighted heaviest: they're the two signals that most reliably push content to new audiences.
Turning viewers into conversations is where growth compounds. Automate your comment replies and DMs.
Start Free — 500 DMs/Month InstantDM AI responds in under 10 seconds, 24/7.Views and likes tell you what already happened. Shares, saves, and retention tell you what will happen next. They're the signals Instagram's ranking systems use to decide whether your content deserves a bigger audience, and this tool weights them accordingly.
A share puts your content in front of a brand-new person, hand-delivered with a personal recommendation. Instagram head Adam Mosseri has publicly said "sends per reach" is one of the most important ranking signals. That's why shares carry the heaviest weight here.
A save is a deliberate, high-intent action: someone decided your content is worth coming back to. Tutorials, checklists, and reference carousels earn the most saves. Saves are the second-heaviest component in the score.
For reels, we compare views to your follower count. Under 1x means the reel mostly stayed inside your existing audience. Above 1x means Instagram pushed it to non-followers; 3-5x or more usually marks breakout distribution.
Instagram tests every reel on a small audience first. If people watch it through (or rewatch it), it gets shown to more people. Your honest read of the retention graph feeds directly into the score. No view count survives a weak hook.
Reel engagement rate = (likes + comments + shares + saves) ÷ views × 100. Measured against followers instead of views, 1-3% is typical. The ranges below are rules of thumb from widely published industry data; real accounts vary a lot by niche and country, so use them as direction, not gospel.
| Metric | Typical | Strong | Exceptional |
|---|---|---|---|
| Engagement rate (by followers) | 1–3% | 3–6% | 6%+ |
| Save rate (of viewers) | 0.5–1% | 1–3% | 3%+ |
| Share rate (of viewers) | 0.1–0.5% | 0.5–1% | 1%+ |
| Reel views ÷ followers | 0.3–1x | 1–3x | 3x+ |
Likes usually make up the vast majority of total interactions, which is exactly why they say the least about future distribution. Two posts with identical likes can perform completely differently depending on their shares and saves. For your average rate across recent posts, use the Instagram engagement rate calculator.
Great content starts conversations. InstantDM finishes them: auto-replies on every comment, keyword-triggered DMs, and AI answers around the clock. Meta Business Partner, from $9.99/month, with a free plan that includes 500 DMs/month.
Measure your account-wide engagement rate against benchmarks.
Log your follower count and project when you'll hit your next milestone.
12 questions to test how well you know Instagram analytics.
Hashtag sets for any niche, organized by reach tier.
A score of 60+ means strong distribution signals. 80+ is the profile of content that spreads well beyond your followers. Under 40 means one or more key signals, usually shares or saves, are weak; the component bars show you which ones to fix first.
The score is a weighted blend of your share rate, save rate, comment rate, like rate, view-to-follower ratio (for reels), and watch-through (for reels). Shares and saves carry the heaviest weight because they are the strongest signals Instagram's ranking systems reward.
Likes are a low-effort tap. Shares and saves are deliberate actions: a share sends your content to a new person, and a save means someone plans to come back to it. Instagram head Adam Mosseri has publicly said "sends per reach" is one of the most important ranking signals.
As a rule of thumb, saves around 1-3% of the people who saw the content is strong. Educational content, tutorials, checklists, and carousels typically earn the highest save rates because people want to return to them later.
It shows how far a reel traveled beyond your existing audience. A ratio under 1x means the reel mostly reached your own followers. Above 1x means Instagram pushed it to non-followers, and 3-5x or more usually indicates breakout distribution.
Usually the reel failed Instagram's first test. Every reel is shown to a small audience first; if watch time and sends are weak, distribution stops there. Fix the first two seconds, trim the reel until people finish it, and give viewers a concrete reason to send it to a friend.
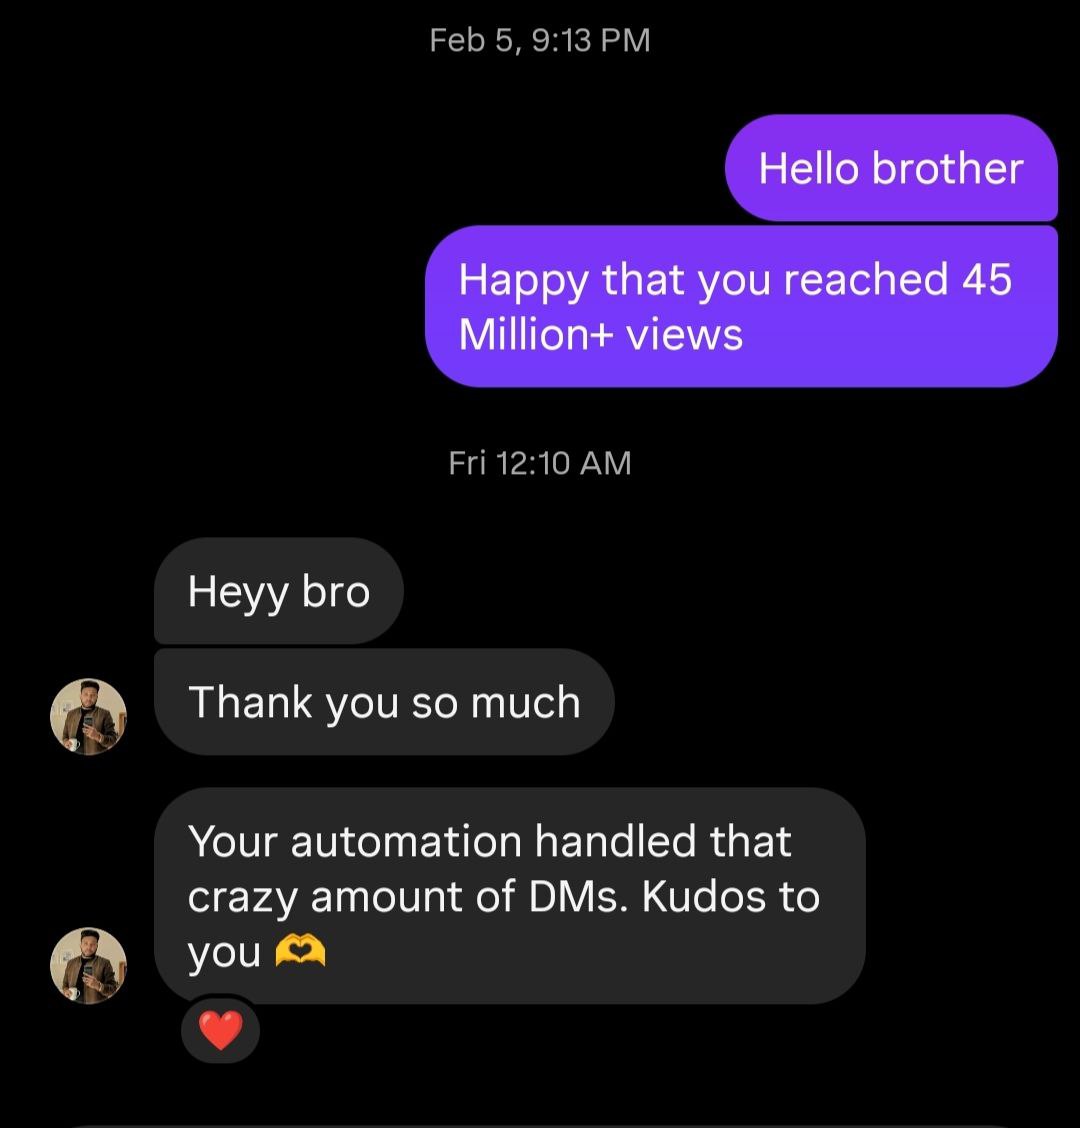
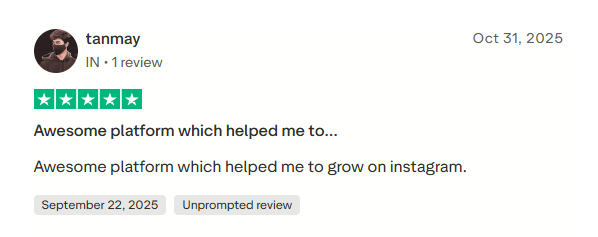
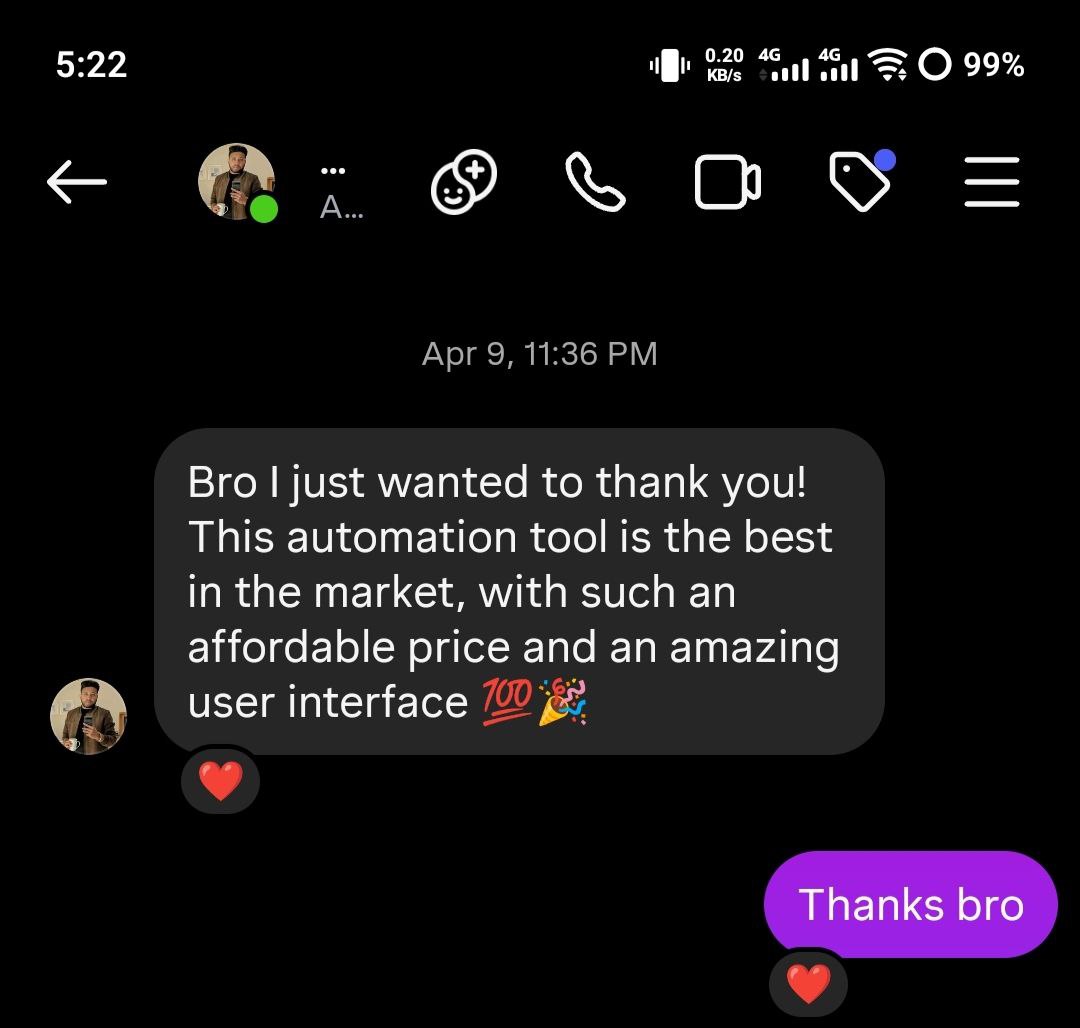
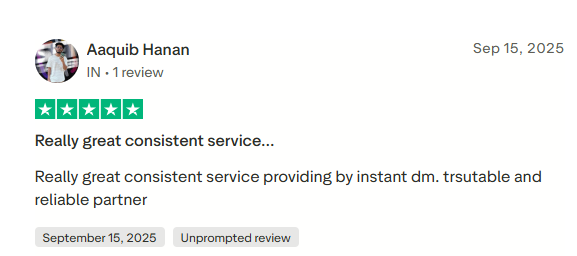
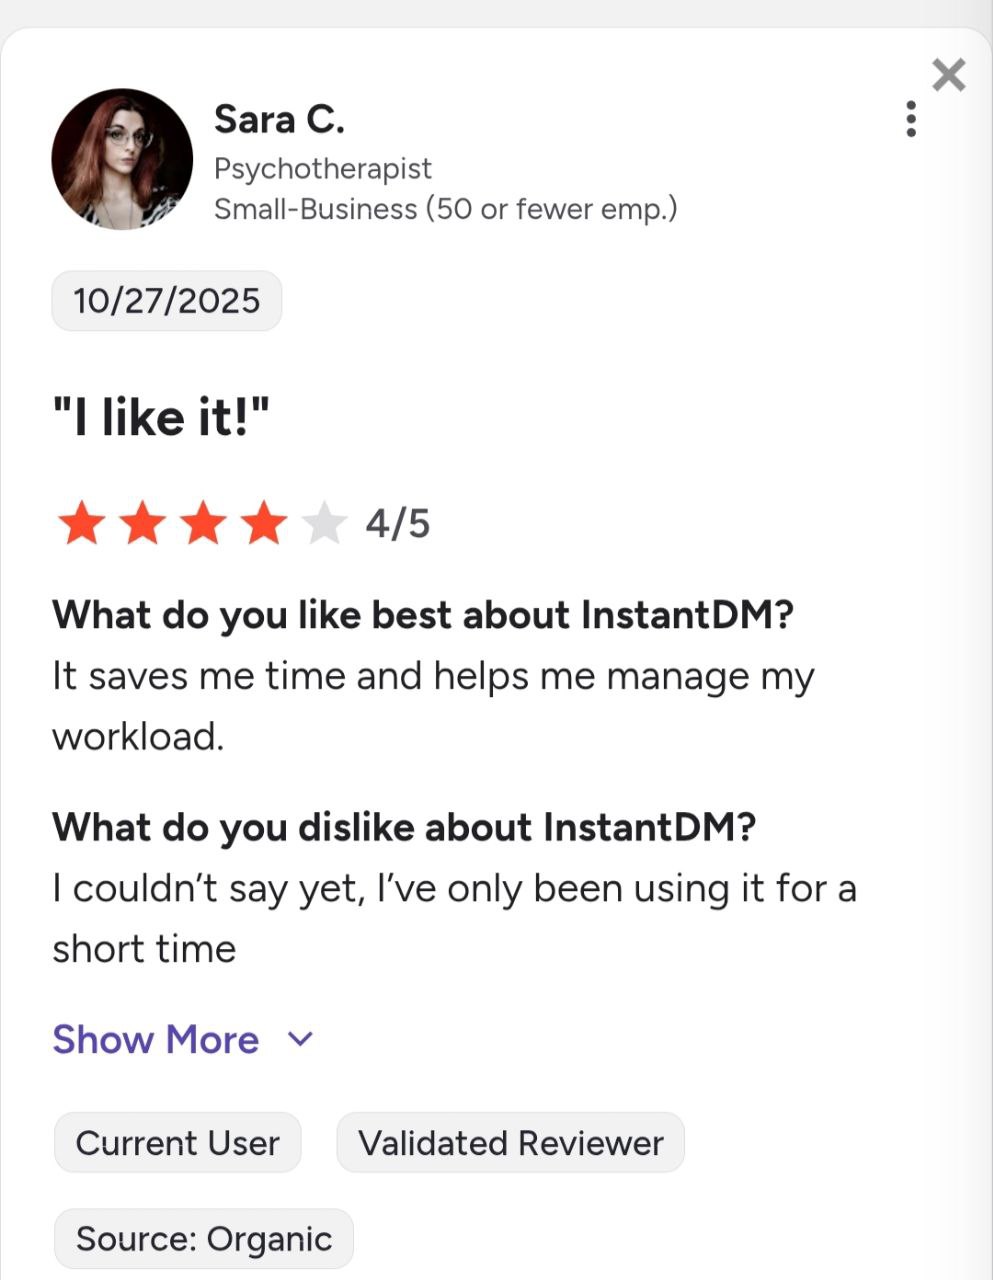
See what creators and brands are saying about InstantDM
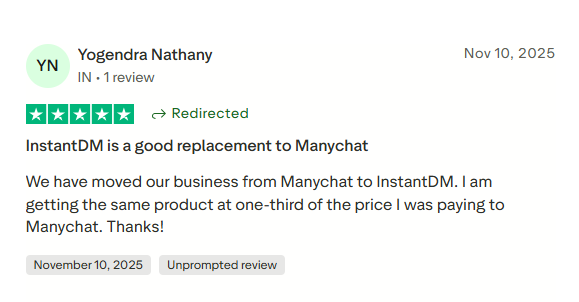
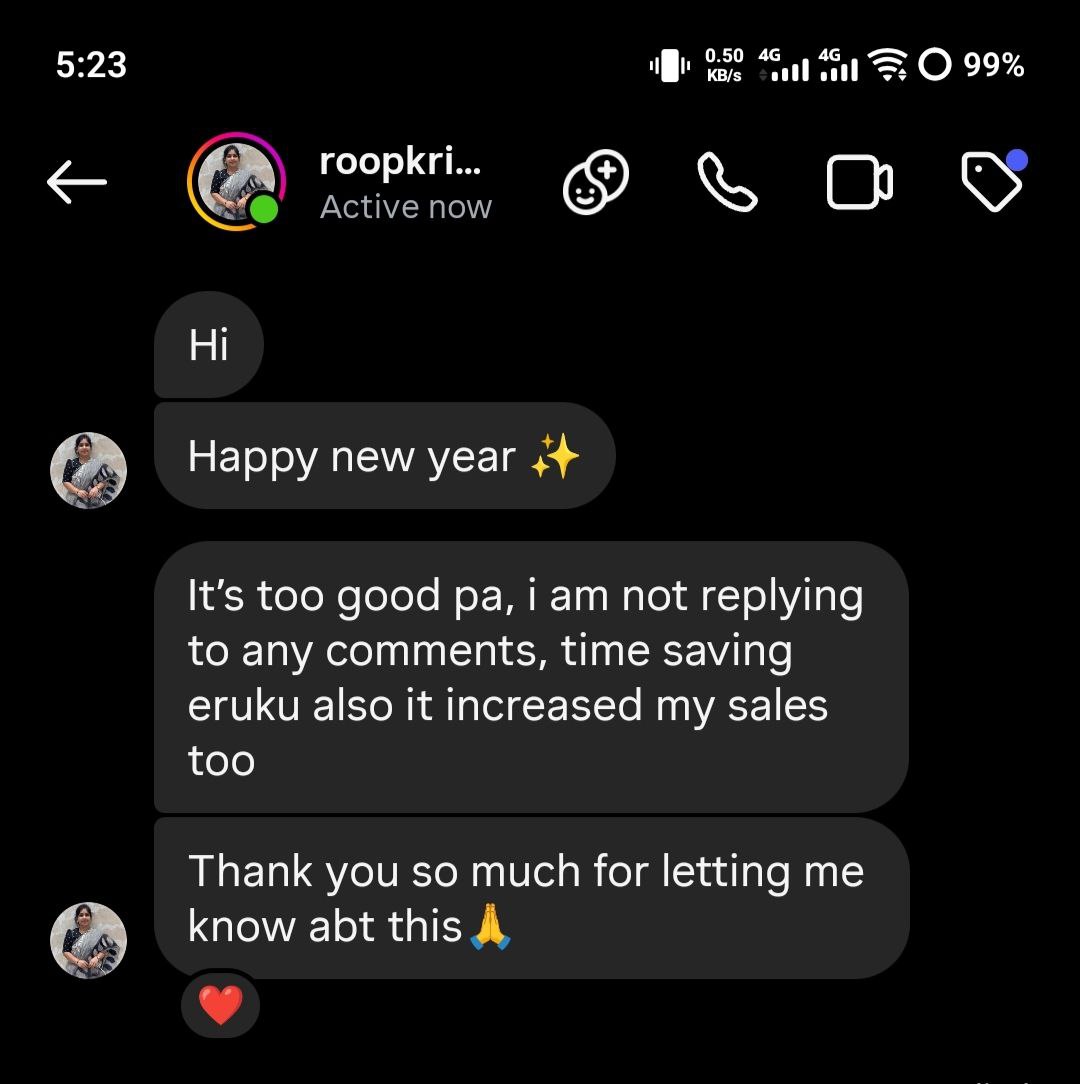
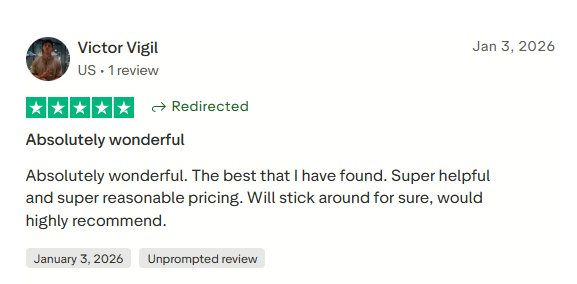

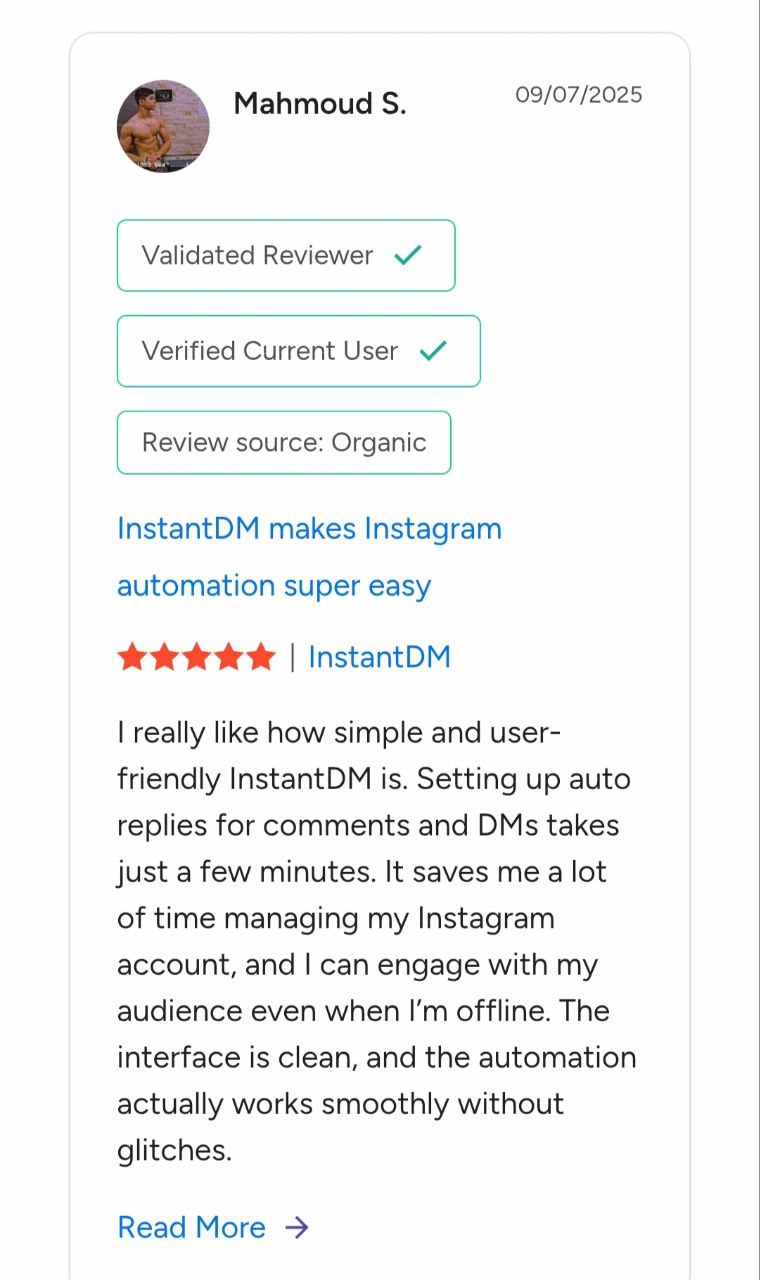
Join 30,000+ creators and brands using InstantDM today.
Get Started NowAny support required, we're just one click away.