
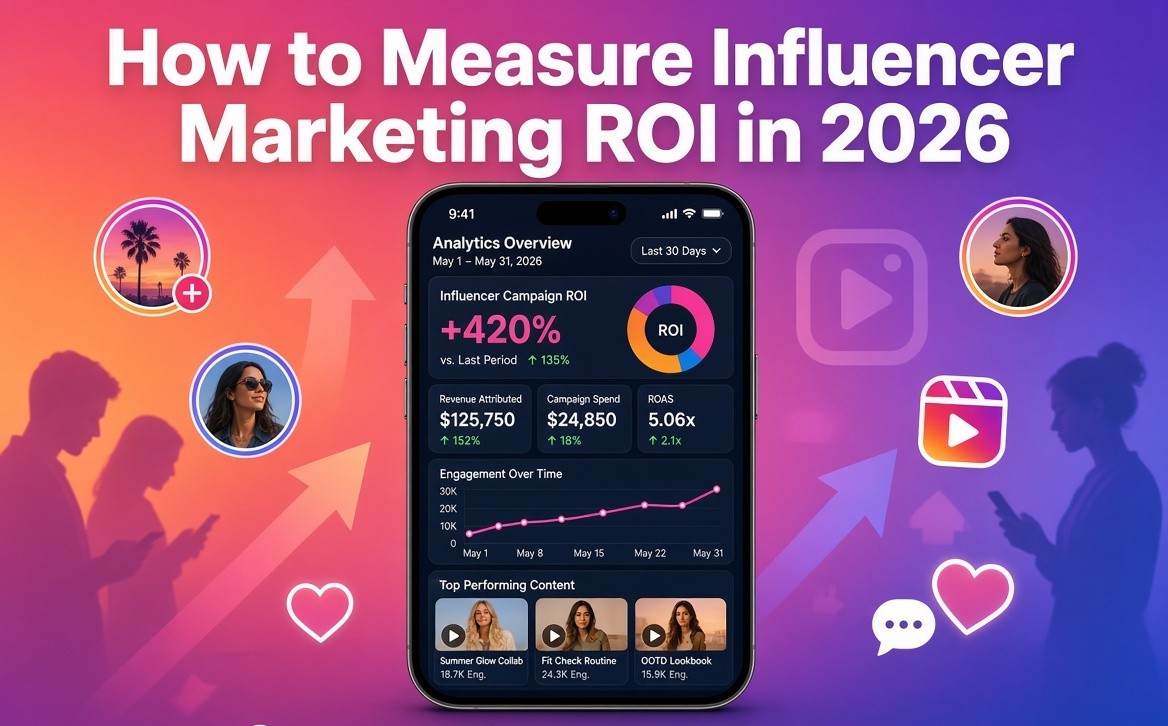
McKinsey’s explainer on influencer marketing frames the channel as paid or gifted creator advocacy that sits between media and word of mouth. That in-between status is why measurement is hard: the post is content, the effect is often a later search, a screenshot, or a conversation, and last-click analytics give the sale to someone else.
The formula:
ROI = (Attributed revenue − Total cost) ÷ Total cost × 100
ROAS is revenue divided by cost. ROI subtracts cost first. A campaign that looks like 5x ROAS can be a weak ROI once seeding, usage rights, labor, and amplification sit in the denominator.
Influencer Marketing Hub’s 2026 statistics put typical return at $5.78 for every dollar spent, and put the industry at an estimated $32.55 billion in 2025. Treat $5.78 as directional and ecommerce-skewed, not a number your finance team should treat as a guarantee. The same report notes that most enterprise marketers still struggle to measure the channel, with attribution as the main gap. A good influencer marketing ROI is one that beats your blended CAC and payback period — after you stop counting vanity metrics as revenue.
Spend is not shrinking while that gap sits open. The IAB Creator Ad Spend and Strategy Report is the planning document buyers use when creator budgets move from “test” to line item. More money without a cost ledger is how vanity reports get funded.
This guide covers what to count, what to ignore, how to track sales when people never click a link, and which number belongs in a finance review versus a brand review.
What real ROI means (and what it does not)

Real ROI answers one question: after every dollar this program consumed, did creator demand create profit you can defend?
It does not answer whether the content looked good, whether the creator’s following grew, or whether that reach would have cost the same as a paid ad. Those are management questions. They are not ROI.
Nielsen’s read on influencer marketing is useful for the demand side: creator recommendations work because they feel closer to a person than to a placement. Trust explains why the channel converts. It does not replace a formula. You still have to separate attention from cash.
If a metric cannot change a spend, cut, or scale decision, it is not an ROI metric. It may still belong on a dashboard. It does not belong in the ROI cell.
| Signal | What it actually measures | Use it for | Do not use it as |
| Follower count | Audience size on a given day | Vetting reach potential | Proof of return |
| Likes | Low-effort reaction | Creative debugging | Sales |
| Raw impressions / reach | Opportunity to see | Delivery and frequency | Revenue |
| Engagement rate | Attention intensity | Fit and content quality | Profit |
| Earned media value (EMV) | Ad-equivalent of exposure | Rough exposure benchmarking | ROI |
| Saves, shares, video completion | Intent and hold | Mid-funnel quality | Cash |
| Promo codes + UTMs | Tracked last-click sales | Floor ROI | Full impact |
| Branded search lift / surveys | Demand you did not click-track | Working-tier estimate | Causal proof |
| Incremental lift | Sales that would not have happened anyway | Causal ROI | Day-to-day reporting for tiny campaigns |
Vanity metrics in influencer marketing are follower count, likes, raw reach, and EMV treated as if they were revenue. They still matter for creative and delivery. They fail as finance.
Earned media value is not ROI. EMV asks what this exposure would have cost as media. ROI asks what profit you kept after you paid for the program. Mixing them is how $5.78 averages get quoted next to campaigns that never reconciled to a bank deposit. BCG’s precision work even uses EMV divided by working spend as an efficiency ratio — useful for targeting, still not profit.
Measurement also does not replace disclosure. The FTC Endorsements, Influencers, and Reviews guidance is about what you may claim to the public, not what you may claim to finance. A clean ROI model on an undisclosed paid post is still a compliance problem.
The REAL ROI Score
Most 2026 guides recycle a stack: awareness, engagement, conversion, amplification. The stack is fine. It is also how every ranking page sounds the same.
Use a score finance can audit.
R — Real costs
Fee is not the program. Add usage and licensing, seeded product and shipping, production and edits, platform or agency fees, paid amplification (including Partnership Ads and allowlisting), measurement (surveys, lift studies), and internal hours at a loaded rate. If you report profit-ROI, include COGS on units sold.
E — Earned demand
Qualified reach among people who could buy, video completion rate, saves and shares, inbound conversations, branded search, and direct traffic during the flight. This layer tells you whether demand moved before a code is redeemed.
A — Attributed revenue
Unique promo codes, unique UTMs, affiliate IDs, post-purchase “how did you hear about us,” CRM source fields, and server-side events (Conversions API) when in-app browsers eat the query string.
L — Lifetime and leverage
90-day LTV and repeat rate of the influencer-acquired cohort versus paid social. Payback period. Content reuse value, because you already paid for the asset. Partnership Ad ROAS on the winning posts.
That last letter is where Deloitte’s work on long-term versus one-off creator partnerships belongs. Their 2026 consumer survey found most people who follow creators return to the same creators, and that creator-influenced purchases cluster among people who already treat those voices as habit, not as a one-week burst. Always-on partnerships show up in LTV and branded search. Burst flights show up in week-one codes. Do not kill an ambassador roster because the first seven days look shy.
Accenture’s view of the creator economy is the commercial backdrop: social commerce is already how a large share of users earn, and brands that treat creators only as media inventory miss the inventory that keeps selling after the flight. Leverage is the reusable asset and the relationship. It is not an extra row of likes.
Real influencer marketing ROI in 2026 is attributed and incremental profit from creator demand, after full campaign cost — including conversions that never click a trackable link.
How to calculate influencer marketing ROI
How do you calculate influencer marketing ROI? Use attributed revenue minus total program cost, divided by total program cost, times 100. The math is trivial. The inputs are where most published “5x ROI” numbers break.
Two formulas that are not interchangeable
| Metric | Formula | What it tells you | When to show it |
| ROAS | Attributed revenue ÷ Total cost | Revenue efficiency | Comparing creator spend to paid ads |
| Revenue-ROI | (Attributed revenue − Total cost) ÷ Total cost | Return before product margin | Marketing reviews |
| Profit-ROI | (Gross profit from attributed sales − Total cost) ÷ Total cost | What the company kept | Finance reviews |
Same campaign, three stories. That is the point.
Worked example
- Creator fees: $6,000
- Seeded product + shipping: $800
- Edit + usage: $400
- Manager time (15 hours × $50): $750
- Paid amplification: $2,000
- Total cost: $9,950
- Tracked revenue (codes + UTMs, 30-day window): $19,000
- Gross margin: 60%, so gross profit on those sales: $11,400
| View | Math | Result |
| ROAS on fees only (the inflated version) | $19,000 ÷ $6,000 | 3.17x |
| ROAS on full cost | $19,000 ÷ $9,950 | 1.91x |
| Revenue-ROI | ($19,000 − $9,950) ÷ $9,950 | 91% |
| Profit-ROI | ($11,400 − $9,950) ÷ $9,950 | 15% |
The “we 3x’d influencer” slide used the first row. The finance-safe row is the last one. Both can be true. Only one should decide next quarter’s budget.
What belongs in total cost
- Creator fees, commissions, bonuses
- Usage, whitelisting, or Partnership Ad rights if priced separately
- Seeded units, shipping, duties, returns on gifts
- Production, editing, usage-right extensions
- Platform, network, or agency fees
- Paid amplification and Spark or Partnership Ad spend
- Measurement (brand-lift survey, incrementality design)
- Internal labor that displaced other work
- Promo-code discount dollars if you treat discount as cost — pick a rule and stay consistent
Teams that log only the flat fee routinely understate spend by 20–40%. That inflation is why average-ROI slides and actual P&L disagree.
Vanity metrics vs the metrics that survive a review
What are vanity metrics in influencer marketing? They are counts of attention that do not tell you whether anyone paid you. In 2026 they still dominate weekly reports because they are easy to screenshot.
BCG’s “precision wins” argument is the targeting version of the same idea: scale without fit wastes working spend. Their precision campaigns were measured as far more efficient at reaching the intended consumer than broad creator buys, with short-window sales lift in categories where social already shapes exploration, including beauty, fashion, pet, food, and childcare. Precision is a selection rule. It still needs the money columns below.
Use this split in the first working session of a campaign, not after the invoice.
Attention — manage creative with these
Reach, impressions, thumb-stop or 3-second views, average watch time, completion rate, saves, shares, comment quality.
Efficiency — compare creators with these
CPM on qualified reach, cost per save, cost per inbound conversation, CTR on the tracked link.
Money — put these in the ROI cell
Attributed revenue, CPA, AOV, ROAS, revenue-ROI, profit-ROI, refund rate, 90-day LTV, payback days.
Causal — use when the budget can support it
Holdout or geo-lift incremental sales. Incrementality answers the only finance question that vanity never will: would this customer have converted without the creator’s content?
Saves and completion rate are not vanity. They are also not ROI. Put them one column to the left of money so nobody converts a high save rate into a budget request.
How to track sales from influencers
How do you track sales from influencers? Run at least two independent tags per creator — a unique promo code and a unique UTM — then add a post-purchase survey so the sales that ignore both tags still have a door into the model.
No single method is complete. Build a ledger of methods, not a faith in one pixel.
| Method | What it captures | Blind spot | Tier |
| Unique promo code | Purchases that use the code | People who discovered you via the creator and paid full price or used another code | Floor |
| Unique UTM / affiliate link | Clicks and on-site conversions from that URL | In-app browsers stripping parameters; later multi-device purchases; screenshot-and-search behavior | Floor |
| Server-side / Conversions API | Events when the browser is a bad witness | Still needs a click or matched identity | Floor / Working |
| Post-purchase survey (“How did you hear about us?”) | Dark social and word of mouth | Self-report bias; people name the last ad they remember | Working |
| Branded search lift | Demand that showed up as your brand plus product during the flight | Concurrent campaigns and seasonality | Working |
| Assisted conversions in GA4 | Paths where the creator was not last click | Model-dependent; easy to double-count if you also sum codes | Working |
| Partnership Ads / allowlisting ROAS | Paid performance of the creator’s asset with platform attribution | Only the amplified slice, not the organic post | Working / Causal-adjacent |
| Holdout or geo-lift | Incremental sales vs a control | Needs scale; expensive to design badly | Causal |
Setup before any post goes live
- One code per creator, never per campaign only.
- One UTM set per creator and per placement (utm_source=instagram, utm_medium=influencer, utm_campaign=spring2026, utm_content=handle).
- Attribution window chosen before launch — 7 days for impulse goods, 14–30 for standard DTC, 60–90 for considered or B2B. Meta’s 7-day-click / 1-day-view default is a platform average, not your sales cycle.
- One survey option that names the creator or “Instagram / TikTok creator,” not just “social.”
- A rule for double-counting: if a sale has both a code and a UTM, count it once.
Promo codes and UTMs are a floor. They understate true impact. Report them as floor. Do not pretend the floor is the building.
When the creator CTA is “message us” or “comment for the link,” the click never exists to tag. That is a measurement problem, not a reason to abandon the floor. For the operations behind inbox capture, see how to manage Instagram DMs to boost sales and the complete Instagram DMs strategy and automation guide.
How to measure ROI when sales are not directly attributable
How do you measure influencer marketing ROI when sales are not directly attributable? Separate observed money from estimated demand, and never add them into one heroic percentage.
A large share of creator-influenced purchases never redeem the code and never keep the link. People screenshot, search the brand, ask in a group chat, or message the creator. That is dark social. Last-click analytics will give that sale to branded search or Direct.
Working tier, when you cannot run a holdout
- Keep the floor (codes + UTMs) as the number you will defend without footnotes.
- Add survey-attributed revenue in a second column labeled “self-reported, not causal.”
- Add branded-search lift × your normal branded conversion rate × AOV as a third column labeled “modeled.”
- Optionally add content replacement cost — what you would have paid a studio for the same usable assets — as value, not as revenue.
Causal tier, when weekly impressions and budget can support it
- Hold out a matched region, audience, or time window.
- Compare conversion or revenue in exposed versus control.
- That delta is incremental. Everything else is commentary.
Untracked does not mean unreal. It also does not mean you may invent a 6x. Floor is a floor. Ceiling is a labeled estimate. Causal is a test.
Conversation paths — comments that cannot carry a click, story replies, DMs, WhatsApp — belong here as an attribution source: a person started a measurable conversation after the post. Log volume and downstream conversion if you have the data. The system for turning those conversations into leads is covered in Instagram lead generation automation.
Floor, Working, Causal
Incrementality is the gold standard. Most teams cannot run it on a $3,000 seeding flight.
| Tier | Who it is for | What you implement | What you are allowed to claim |
| Floor | Any budget, first campaign, one-off collab | Unique code + unique UTM + 7–30 day window + full cost ledger | Tracked ROI was X. This is a lower bound. |
| Working | Steady mid-size programs | Floor + survey + branded search + assisted conversions + 30–90 day window + per-creator scorecard | Tracked floor was X. Modeled ceiling was Y. Y is not incremental. |
| Causal | Always-on or large flights | Working + holdout / geo-lift and/or Partnership Ad experiments | Incremental ROI was Z versus control. |
Move up a tier when a decision requires it — renewing a six-figure roster, cutting paid social to fund creators, or defending the channel in a board pack.
Deloitte’s long-term partnership case is a Working-to-Causal argument: habitual creator audiences do not resolve in a 7-day pixel window. If you only fund one-off posts, your Floor will look like the whole truth and it will not be.
2026 benchmarks — use them, then distrust them
What is a good influencer marketing ROI in 2026? The figure you will see everywhere is $5.78 in revenue per $1 spent from Influencer Marketing Hub’s statistics compilation. Top-end case studies claim $11–$20. First campaigns in practitioner writeups often target 2–3x ROAS; optimized always-on programs are often described as 4–6x.
Read those figures as weather, not law.
- They lean on ecommerce and self-report.
- They rarely publish a standard cost ledger.
- They collapse ROAS and ROI.
- They hide refunds, discounts, and labor.
- B2B and long sales cycles will not match a 14-day DTC window.
The IAB spend report tells you the budget is professionalizing. It does not tell you your return. BCG’s precision numbers — efficiency versus spray-and-pray, short-window sales lift in high-social categories — tell you targeting quality moves results. They still are not a substitute for your CAC.
A better internal target
- Floor CPA within about 15% of your current blended CAC at the same window.
- 90-day LTV of the influencer cohort at least equal to paid-social LTV.
- Payback no worse than the channel you would cut to fund this.
- Refund and return rate no worse than site average.
Nano and micro creators often show stronger efficiency — engagement and conversion per dollar — than macros. Macros still win some awareness jobs. Do not average them into one ROI and call the roster healthy. That is BCG’s precision point in spreadsheet form.
Per-creator scorecard
Campaign ROI that looks fine can hide two creators who printed money and four who burned it.
Score every creator on the same sheet.
Identity: handle, tier, platforms, fee, seeded COGS, usage fee.
Delivery: posts live, on-brief, usage rights in hand.
Demand: qualified reach, completion rate, saves, inbound conversations.
Money: code redemptions, UTM revenue, survey mentions, tracked revenue, CPA, refunds.
Decision: keep, cut, or retest.
Rules
- Cut: tracked revenue below 50% of fully loaded cost and weak demand signals — low completion, low saves, no conversations.
- Retest: strong demand, weak tracked revenue. The offer, landing page, or window is the suspect, not only the creator.
- Keep or scale: floor ROI positive, or demand plus survey plus search lift strong enough to justify a Working-tier exception, written down.
Partnership Ads belong on this sheet as a second row for the same creator: organic floor versus amplified ROAS. A creator who is expensive organically and cheap as a paid asset is not a failed collab. It is a media supply chain.
Fit over follower count is also Deloitte’s selection rule: consumers already cluster around a small set of creators they return to. Paying a larger, colder list is how Floor ROI dies.
Three worked examples
Numbers are illustrative. The structure is what to copy.
$2,000 nano seeding flight (Floor)
- 8 nano creators, product only + $200 shipping + 8 hours of ops at $400 = $2,000
- Unique codes + UTMs, 14-day window
- Tracked revenue: $3,100
- Revenue-ROI: ($3,100 − $2,000) ÷ $2,000 = 55%
- Survey adds another $900 from people who named “TikTok creator” — report as ceiling, not blended 100% ROI
Decision: retest the two creators who drove 70% of codes; cut the rest.
$12,000 micro roster (Working)
- Fees $8,000, seeding $1,200, labor $1,300, tools $500, light amplification $1,000 = $12,000
- 30-day window, codes + UTMs + survey + branded search
- Floor tracked revenue: $21,400 → revenue-ROI 78%, ROAS 1.78x
- Survey + modeled search lift: +$7,200 labeled ceiling
- 90-day repeat on the tracked cohort: 18% vs 14% on Meta prospecting
Decision: scale the three creators with CPA below blended CAC; move their assets into Partnership Ads.
$50,000 always-on + Partnership Ads (Causal-adjacent)
- Fees $28,000, usage $6,000, seeding $3,000, labor $4,000, amplification $9,000 = $50,000
- Floor tracked: $92,000
- Partnership Ad ROAS on allowlisted posts: 3.4x on the $9,000 slice
- Two-market geo-holdout: +11% incremental revenue in exposed markets after controlling baseline
Decision: the organic floor alone does not justify $50k. The incremental lift plus reusable assets does. Renew with the lift design kept in the statement of work. This is the Deloitte shape: continuity plus measurement, not a larger one-off invoice.
None of these examples convert EMV into an ROI percentage.
What to put on one finance slide
How do you report influencer ROI to leadership? One page, four numbers, one decision.
- Ask: what you spent, full ledger.
- Floor: tracked ROAS and revenue-ROI, window stated.
- Gap: one sentence — codes and links miss dark social; survey and search suggest a higher ceiling of $X, not in the floor.
- Causal status: not tested, scheduled, or result.
- Quality: 90-day LTV or refund rate versus paid social.
- Decision: scale, hold, or cut, with the creator names attached.
If the slide needs a screenshot of likes to feel complete, the program is still being managed as PR. That is allowed. It is not measurement.
If leadership asks whether the channel is “real,” use the IAB spend trajectory and the Hub $5.78 average only as context, then put your Floor on the same slide so the industry number cannot hide your ledger.
2026 mechanics that break last year’s spreadsheet
In-app browsers and UTMs. A large share of Instagram and TikTok taps never deliver a clean query string to your site. Pair every link with a code. Send important events through Conversions API or your server, not only a browser pixel.
Partnership Ads and allowlisting. The cleanest paid read on a creator asset. Do not mix organic floor and paid ROAS into one cell without labeling the split.
TikTok Shop versus organic mention. Shop checkout is closer to affiliate tracking. A talking-head recommendation of a sitewide SKU is closer to dark social. Measure them as different jobs.
Non-clickable comments and conversation handoff. If the CTA is “comment X” or “message us,” your ROI system must accept a conversation as a mid-funnel event. Count it. Do not pretend GA4 will invent the click. Inbox operations belong in your DM sales and DM strategy playbooks. The ROI cell still needs the code, the UTM, or the survey.
Windows. Impulse beauty and food can live in 7 days. A $400 gadget or a B2B tool cannot. If your ROI dies on day 8, you may have a window problem, not a creator problem.
Always-on versus burst. Burst campaigns over-index on first-touch drama. Ambassador programs show up in LTV and branded search. Deloitte’s consumer data is the reason to keep the longer window on retainers.
Claims versus math. FTC endorsement rules decide what the public post may say. Your spreadsheet decides what finance may say. Run both.
Tools are plumbing, not the score
You need a place for costs, a place for codes, a place for site analytics, and a place for the survey. That can be a spreadsheet plus GA4 plus your ecommerce or CRM. Platforms help when the roster is large. They do not create incrementality by existing.
Minimum stack: cost and creator ledger, unique codes and UTMs, ecommerce or billing source of truth, GA4 with a consistent UTM grammar, one survey field. Optional: listening, Partnership Ad reporting, a lift study when you reach Causal.
If conversation volume is part of earned demand, pick inbox software on its own merits — see best Instagram DM automation tools — and still export a per-creator money row. If a tool cannot export that row, it is a workflow tool, not a measurement system.
ROI calculator you can copy
Build one workbook with three tabs.
Campaign ROI. Inputs: dates, objective, window, every cost line, tracked revenue lines, optional COGS percentage, optional survey and search estimates. Outputs: total cost, floor revenue, ROAS, revenue-ROI, profit-ROI, labeled ceiling, payback days. On the sheet itself: floor understates; ceiling is not incrementality.
Per-creator scorecard. One row per creator: fee, extras, reach, completion, saves, conversations, code revenue, UTM revenue, survey mentions, tracked total, CPA, refunds, 90-day repeat, keep / cut / retest.
Finance one-pager. Six fields only: spent, floor ROI and ROAS, what the floor misses, causal status, cohort quality, decision.
Key takeaways
- How to measure influencer marketing ROI: (attributed revenue − full cost) ÷ full cost × 100.
- Real ROI is profit after the whole ledger. Engagement is not a substitute.
- ROAS and ROI are different. Show both.
- EMV is not ROI.
- Codes and UTMs are a floor. Surveys and search lift are a labeled ceiling. Holdouts are causal.
- The $5.78 average from Influencer Marketing Hub is context. Beat your own CAC.
- Precision (BCG) and continuity (Deloitte) change which creators you keep. They do not replace the ledger.
- Score creators individually or the average will lie.
- Match the attribution window to how customers actually buy.
- Put four numbers on the finance slide, not a gallery of likes.